Showing posts with label stocks. Show all posts

Sunday, May 24, 2009

Fed Series M2, Money Supply Still Soaring (Chart)


Fed Data, M2, Money Stock, Chart


We wrote several months ago about how it takes 12-18 months for increases in money supply to effect interest rates and commodity prices. We are now in this window.

The dramatic increases in money supply, the Fed balance sheet, and the drop in the dollar are starting to weigh on investor confidence.

Stocks rarely rise when confidence dwindles. It now seems we are moving from what was growing confidence in the markets to growing uncertainty.

The risk of owning equities on a short term basis not outweighs the reward. The threat of rising interest rates has also risen dramatically. This weeks surge in Gold is another barometer of investor confidence.
Subscribe to EF Hutton via Email

Bob DeMarco is a citizen journalist and twenty year Wall Street veteran. Bob has written more than 500 articles with more than 11,000 links to his work on the Internet. Content from E F Hutton has been syndicated on Reuters, the Wall Street Journal, Fox News, Pluck, Blog Critics, and a growing list of newspaper websites. Bob is actively seeking syndication and writing assignments.


Follow E F Hutton on Twitter

Kindle: Amazon's Wireless Reading Device (Latest Generation)

Monday, May 18, 2009

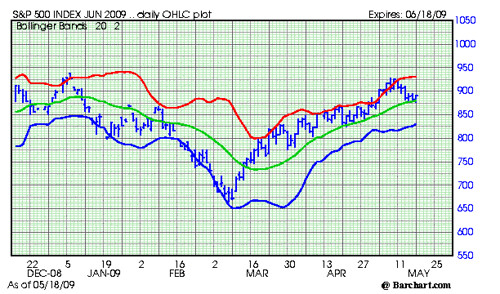
S and P Under Pressure, Holding the Green Line (Chart)


June S and P Future, Bar, Chart

June S and P Chart 518


The S and P is banging off the green line, the first area of major support. Overnight, the market hit 875.40 which is the top of a major swing point in the market (865 - 875).

The market remains vulnerable, but the hold at this level brings into question which way next.

On the way back up, 895-900 is the critical level. On the way down, 865 is critical.

Short term it appears that the market will remain under pressure for the next two weeks.

Technical resilance is dwindling and this could be signaling a change in trend to the downside.

The risk reward ratio is not currently favoring short term long positions
Subscribe to EF Hutton via Email

Wednesday, May 13, 2009

Retail Sales a Picture Worth a Thousand Words--UGH (Chart)


Retail sales dropped .4 percent for the month and are down 10.1 percent year over year. Retail sales account for two thirds of GDP. This report is bearish on the market.

There is a strong relationship between GDP and stocks. This report really puts pressure on relative valuations. The risk of owning stocks is mounting as we pointed out last week in our article --They called me crazy, S and P 900-1000 (Part Two)
  • A major retracement to the downside is likely, and is imminent.
  • The bottom line. The risks out weigh the rewards at this level.
The S and P was trading near 925 when we wrote that. Now down 4 percent.

We will update the S and P numbers shortly.


Subscribe to EF Hutton via Email
Bob DeMarco is a citizen journalist and twenty year Wall Street veteran. Bob has written more than 500 articles with more than 11,000 links to his work on the Internet. Content from All American Investor has been syndicated on Reuters, the Wall Street Journal, Fox News, Pluck, Blog Critics, and a growing list of newspaper websites. Bob is actively seeking syndication and writing assignments.


Follow E F Hutton on Twitter

Thursday, April 30, 2009

Fed Monetizing Debt -- How long before the Inflation Comes?


No matter how you cut or slice it, the FED is going to monetize debt. This means you want to be owning stocks and ETFs that benefit from an increase in inflation.

Over the next week, we will be putting up some of our ideas on how to take advantage of this scenario.

If you have been following the charts on All American Investor -- you noticed that I have been talking about rising rates in the ten and thirty year treasuries for a few weeks. If you are not paying close attention to this as in investor you are making a big mistake.

The bond vigilantes are coming back, and soon with a vengeance. Longer dated treasury interest rates are drifting up. This, in spite, of massive buying of treasuries by the FED -- we showed the balance sheet on Saturday.

Here is a snippet from the latest FOMC release:

As previously announced, to provide support to mortgage lending and housing markets and to improve overall conditions in private credit markets, the Federal Reserve will purchase a total of up to $1.25 trillion of agency mortgage-backed securities and up to $200 billion of agency debt by the end of the year. In addition, the Federal Reserve will buy up to $300 billion of Treasury securities by autumn. The Committee will continue to evaluate the timing and overall amounts of its purchases of securities in light of the evolving economic outlook and conditions in financial markets. The Federal Reserve is facilitating the extension of credit to households and businesses and supporting the functioning of financial markets through a range of liquidity programs. The Committee will continue to carefully monitor the size and composition of the Federal Reserve's balance sheet in light of financial and economic developments.

Buy $300 billion of treasuries by Autumn?

The best way to think of the current scenario is like boiling water in a tea pot. Sooner or later, the whistle will blow.

Don't like the above? Remember, I am the same guy that predicted this really in stocks when I wrote:
  • They call me crazy -- S and P 900-1000
  • and, Stocks Don't Fight the Tape.
There is a lot of chicken on the hill. My guess here right now is: material stocks, commodity stocks, related ETFs and short the long bond.
Subscribe to All American Investor via Email

Tuesday, April 28, 2009

Insiders Selling into Rally


Is this a good or a bad thing? I know one thing it is never a good sign when insiders start selling. Insider selling is often a barometer of confidence.

Lack of confidence in their own company by insiders is often followed by negative reporting down the road.

Is it panic? Or, is the outlooks so dismal that insiders want to get out why the gettin is good.

If you own a stock, and the insiders are selling, it is usually a red flag.
Executives and insiders at U.S. companies are taking advantage of the steepest stock market gains since 1938 to unload shares at the fastest pace since the start of the bear market.
While the Standard & Poor’s 500 Index climbed 28 percent from a 12-year low on March 9, CEOs, directors and senior officers at U.S. companies sold $353 million of equities this month, or 8.3 times more than they bought, data compiled by Washington Service, a Bethesda, Maryland-based research firm, show. That’s a warning sign because insiders usually have more information about their companies’ prospects than anyone else, according to William Stone at PNC Financial Services Group Inc.
Do insiders know something you don't know?

Insider Selling Jumps to Highest Level Since 2007
Subscribe to EF Hutton via Email


Bob DeMarco is a citizen journalist and twenty year Wall Street veteran. Bob has written more than 500 articles with more than 11,000 links to his work on the Internet. Content from All American Investor has been syndicated on Reuters, the Wall Street Journal, Fox News, Pluck, Blog Critics, and a growing list of newspaper websites. Bob is actively seeking syndication and writing assignments.


Follow E F Hutton on Twitter


Thursday, April 09, 2009

Stocks the Nervous Norvis Market (Chart and View)


There are a lot of Nervous Norvises out there.

When the market moves down for a couple of days your typical Nervous Norvis bull gets sweaty palms and heart palpitations. A couple of days down and the bears are pounding their chest. The only thing the bears can think about is bad news. Left to wonder of course, why is the market going up with all this bad news--the world is coming to an end.

Stocks the Nervous Norvis Market

The Stock market is in a classic uptrend from the capitulation low.

Review:
At the moment:
  • The market continues to make higher lows. The most important ingredient of a trend.
  • The market found support on a dip three times. This indicates there are buyers below the market. This is necessary to raise confidence.
  • Bears continue to try and sell the market. The big difference they are running for cover at the first sign of strength.
  • The slope of the green line (midpoint, support) continues to point up and is strengthening.
  • The blue line is picking up momentum and as long as this continues it will help propel the market higher,
  • The market is once again approaching the red line (two standard deviations up) and this should be watched. Short term traders should resist the urge to buy the market when it is at, near, or above the red line. This is where nervous norvises really get killed.
  • There is still substantial resistance from 850-875. This is where the market will likely wear out bulls who lack patience. They will get out and will likely start chasing it right into the top and before the next major test of the downside.
Subscribe to EF Hutton via Email


Bob DeMarco is a citizen journalist and twenty year Wall Street veteran. Bob has written more than 500 articles with more than 11,000 links to his work on the Internet. Content from All American Investor has been syndicated on Reuters, the Wall Street Journal, Fox News, Pluck, Blog Critics, and a growing list of newspaper websites. Bob is actively seeking syndication and writing assignments.


Follow E F Hutton on Twitter

Thursday, April 02, 2009

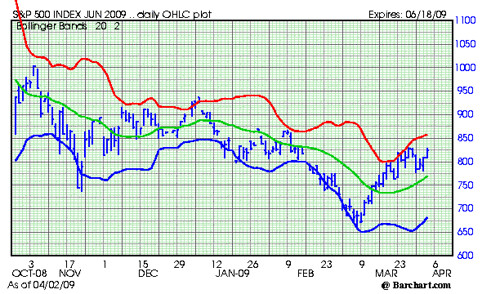
S & P 500 Trend Up, Shorts Vunerable


June S and P Future, Chart

JUNE SP 4021

Notes:
  • The market held the down thrust below 790. The reversal indicates the uptrend is intact.
  • Yesterday's outside, up day, with a close at the high indicated that a test of the resistance in the 830 area was likely.
  • The ability of the market to hold above the green line is important and impressive.
  • Short term support is at 770 and rising.
  • Near term resistance is in the 830 area. Overhead resistance is at 857 and rising.
  • Trades and or a close above 832 will test the will of the shorts.
  • The market continues to trade up against bad news. Shorts continue to pile into the market believing that the market should be going down against this evidence.
  • All I can say to shorts is---Don't Fight the Tape.
  • Technical evidence continues to indicate higher prices.
See:

They called me crazy, S and P 900-1000


Bob DeMarco is a citizen journalist and twenty year Wall Street veteran. Bob has written more than 500 articles with more than 11,000 links to his work on the Internet. Content from All American Investor has been syndicated on Reuters, the Wall Street Journal, Fox News, Pluck, Blog Critics, and a growing list of newspaper websites. Bob is actively seeking syndication and writing assignments.


Follow E F Hutton on Twitter
Subscribe to EF Hutton via Email

Wednesday, April 01, 2009

S & P 500 Stress Test for the Bears


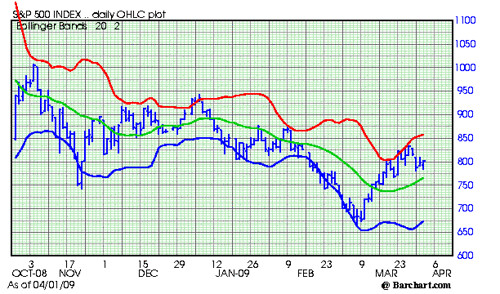
S and P 500, Chart, Daily, Midday.

S & P 500 Stress Test

Highlights:
  • It is early in the day but the market made a new low, below yesterday's low, reversed, and is now clawing its way back over 800. A positive short term development.
  • The chart gap is still in play. The S & P needs to trade to 813.43 to fill the gap. This area should be watched closely.
  • Trading is slow so far. However, it the market closes above that gap the bears will be forced to run for cover.
  • A close above yesterday's high of 810.48 would give us an outside up day. That would be very bullish. It would also give us another hook up in the chart.
  • We need to watch closely to be sure support is building below the market. A pattern of higher highs and higher lows is what we are looking for to remain bullish.
In spite of all the bear chatter and shorting in the market, the S and P is only 30 points from the high for this move--made last week. A move above yesterday's high will put extreme pressure on the bears.

Looks like a bear stress test to me so far.
Subscribe to All American Investor via Email

Bob DeMarco is a citizen journalist and twenty year Wall Street veteran. Bob has written more than 500 articles with more than 11,000 links to his work on the Internet. Content from All American Investor has been syndicated on Reuters, the Wall Street Journal, Fox News, Pluck, Blog Critics, and a growing list of newspaper websites. Bob is actively seeking syndication and writing assignments.


More from All American Investor


Sunday, March 22, 2009

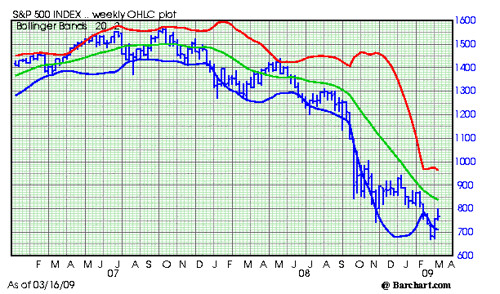
S and P 500 Weekly Chart


S an P 500 Weekly Chart March


On March 7, we posted the Monthly chart of the S and P 500 and pointed out the slope of the market was unsustainable and that a rally was likely. From that article,
You can see the slope of the market is very severe. This cannot be sustained much longer. When a market index trades down at a sharp angle like the one above (See March 7 chart), the market always rallies sharply when it reverses directions. This rally could start at any time.
Since then, we had two weeks up in the market as shown in the weekly chart above.

Now the question is what next? Technically this is a difficult question to answer. I would say this week is fifty-fifty. As you can see, the downtrend is still intact. The market is now above the blue line which indicates the severe oversold condition is not over. Overall, it is always more risky to be a buyer when the trend of the market is down--so it is still a time to be very cautious. I would also so, at this point the easy money has already been made on the downside. Toss up.

My best guess right now is that market is going to continue to consolidate and move sideways in the area between 663 and 800 before it makes its next move. On the fundamental side, I will be posting a new article entitled, Don't Fight the Tape, which makes an argument for additional upside in the market.
Subscribe to EF Hutton via Email
Bob DeMarco is a citizen journalist and twenty year Wall Street veteran. Bob has written more than 500 articles with more than 11,000 links to his work on the Internet. Content from All American Investor has been syndicated on Reuters, the Wall Street Journal, Fox News, Pluck, Blog Critics, and a growing list of newspaper websites. Bob is actively seeking syndication and writing assignments.

Tuesday, March 10, 2009

Doctor Doom Nouriel Roubini: Stock Market to Go Much Lower


This is directly from an email I received from the RGE Monitor.

Roubini of RGE Monitor: Stock Market to Go Much Lower

Can we rule out another bear market rally some time in 2009?
No, we cannot rule out another bear market sucker’s rally in 2009, most likely in Q2 or Q3. The drivers of this rally will be the improvement in second derivatives of economic growth and activity in U.S. and China that the policy stimulus will provide on a temporary basis. Given the severity of macro, household, financial firms and corporate imbalances in the U.S. and around the world this Q2 or Q3 sucker’s market rally will fizzle out later in the year like the previous 5 ones in the last 12 months.
Subscribe to EF Hutton via Email

What are the downside risks to these bearish predictions for U.S. and global equities?
On the downside there is at least a third probability of an L-shaped global near depression rather than the mere current severe U-shaped recession. If a near depression were to take hold globally a 40% to 50% further fall in U.S. and global equities from current levels could not be ruled out. But in this L-shaped near depression the last thing one would have to worry about would be stock markets as more severe issues would have to be addressed.
What are the upside risks to these bearish predictions for U.S. and global equities?
On the upside, we have an aggressive policy stimulus in the U.S. and other countries that might lead to a faster sustained economic and financial markets recovery that expected here. The bullish argument for a non-bear market and early persistent recovery of global equities is based on a better than expected recovery of the U.S. and global economy.
Bottom Line: P/E and S&P Index
Earnings per share (EPS) of S&P 500 firms will be in the $ 50 to 60 range, but they could fall to $40. The price earnings (P/E) ratio may fall in the 10 to 12 range in a U-shaped recession. If earnings are closer to 50 or the P/E ratio falls to 10 then the S&P could fall to 600 (12 x 50 or 10 x 60) or even to 500 (10 x 50). Equivalently the Dow (DJIA) would be at least as low as 7000 and possibly as low as 6000 or 5000.


Nouriel expounded the above topics further at the CBOE 25th Annual Risk Management Conference at Laguna Beach where he was the keynote speaker.

Read more of Nouriel’s and other RGE Monitor analysts’ views on the current economic and financial situation on www.rgemonitor.com or contact sales at info@rgemonitor.com.

Bob DeMarco is a citizen journalist, blogger, and Caregiver. Bob has written more than 500 articles with more than 11,000 links to his work on the Internet. The content has been syndicated on Reuters, the Wall Street Journal, Fox News, Pluck, Blog Critics, and a growing list of newspaper websites. Bob is actively seeking syndication and writing assignments.


Thursday, March 05, 2009

Market Capitulation Means Opportunity to Take Real Money Out of the Market


A market capitulation occurs when investors surrender all hope of recouping their losses in the market. For me, a capitulation means when investors "puke", or cry uncle. We could be on the edge of a market capitulation right now. It could happen as early as tomorrow morning or Monday morning.


In order to win big at the point of a market capitulation you have to be ready to roll before it happens. You might be expecting a capitulation several times before it actually happens. But, when it does, you can take real money out of the market.
Subscribe to EF Hutton via Email

Here is how you take advantage of a market capitulation. First, you identify a small number of great companies whose stocks have been getting hammered because the market is going down, not because they are doing poorly. You have your orders placed in the market well before the market opens in the morning. You place those orders on the stocks you want to buy 8-10 percent below the previous day's close. You are ready to roll.

When a market capitulation occurs, a virtual tsunami of orders all come in on one side--sell orders. When the orders start piling up, funds manager realize they are going to need to raise cash. So they take the easiest, most efficient path to accomplishing that mission--they hit the bid on the best capitalized companies with the biggest bid regardless of the long term outlook on the company. They need cash and that is the name of the game.

When the herd sees their stock getting slammed they are not thinking about the above, they are thinking about survival. They fire in their panic stricken sell orders. The short term investors who have been trying to pick the bottom for a long time can no longer stand the heat. They sell and add fuel to the fire (well, fire sale).

You now have perfect storm--nothing but sellers. Sellers willing to part with stocks at any price--no matter how low. And, you are willing to buy at those amazingly low prices.

Do you know how many stocks traded at prices never to be seen again on October 19, 1987? Imagine buying Intel (INTC) at 88 cents a share, or Microsoft (MSFT) at 31 cents a share (adjusted historical prices, Google Finance).

That is what opportunity looks like when it knocks.

You will be well advised to be placing orders in the market before you go to bed. Remember, 8-10 percent below the last price.

Market capitulations are impossible to predict. But, we may get one here.

Ask yourself this question--are investors reaching the point where they can't take it anymore? Are 100,000s of investors all around the world getting ready to throw in the towel? The phenomena that is getting ready to occur is known as the--madness of the crowd. This could be it.

Please note: I am the same guy that said, Cash is King, back in September. I wrote-- Financial Meltdown--Where there is Smoke, there is Fire--an article that predicted AIG and the coming financial debacle. The S and P 500 was well above 1200 when I wrote that article. You could have read it right here at All American Investor.
Bob DeMarco is a citizen journalist, blogger, and Caregiver. In addition to being an experienced writer he taught at the University of Georgia , was an Associate Director and Limited Partner at Bear Stearns, was CEO of IP Group, and is a mentor. Bob currently resides in Delray Beach, FL where he cares for his mother, Dorothy, who suffers from Alzheimer's disease. Bob has written more than 500 articles with more than 11,000 links to his work on the Internet. His content has been syndicated on Reuters, the Wall Street Journal, Fox News, Pluck, Blog Critics, and a growing list of newspaper websites. Bob is actively seeking syndication and writing assignments.


More from All American Investor


Friday, February 27, 2009

Stock Market Crash--25 year look--Chart


The chart below spans twenty five years for the S and P 500. Each bar is one month.

I have been writing for two weeks about the downside range expansion in the market (see previous posts). The range expansion is still in force. Last time, I mentioned that the market rarely closes lower 7 days in a row and it was due for a rally from the 741 area. The rallies which usually last two days came and went like the weather in Amarillo.

I want to issue a major note of caution here. The formation above could be signaling a market capitulation. Think about it like flushing a toilet. You know what goes down the toilet=, but then the bowl fills right back up. My guess is, if flushed it will be a great opportunity. Markets rarely capitulate, however, when everyone is looking for it.
A look at this long term pattern shows that the market is extremely vulnerable. The fundamental news, especially the size of budget deficit continues to weigh on the market. The only question now is do we go down slow or fast.

For today, the S and P will find good support on any thrust under 732. So don't get nutty with the short positions.

This will be the third straight week down and sixth out of the last seven. This indicates the market is due for a good rally soon. But from what level? New shorts at this level don't make much sense.
clipped from charts.barchart.com

Chart for S and P 500


Follow EF Hutton on Twitter
Subscribe to EF Hutton via Email


Bob DeMarco is a citizen journalist, blogger, and Caregiver. In addition to being an experienced writer he taught at the University of Georgia , managed on Wall Street at Bear Stearns, was CEO of IP Group, and is a mentor. Bob currently resides in Delray Beach, FL where he cares for his mother, Dorothy, who suffers from Alzheimer's disease. Bob has written more than 500 articles with more than 11,000 links to his work on the Internet. His content has been syndicated on Reuters, the Wall Street Journal, Fox News, Pluck, BlogCritics, and a growing list of newspaper websites (15). Bob is actively seeking writing assignments and syndication.


More from All American Investor


Eight Stocks now make up Fifty Percent of the Dow Jones Industrial Average


These eight stocks now make up 50 percent of the Dow Jones Industrial average.

Stocks and weighting in percent.
  • IBM (9.4)

  • ExxonMobil (7.89)

  • Chevron (6.96)

  • McDonalds (5.95)

  • Johnson and Johnson (5.91)

  • Proctor and Gamble (5.47)

  • Walmart (5.39)

  • 3M (5.11)

Cumulatively that is 52.08 percent of the Dow Jones Industrial Average (DOW).

Follow EF Hutton on Twitter
Subscribe to EF Hutton via Email


Bob DeMarco is a citizen journalist, blogger, and Caregiver. In addition to being an experienced writer he taught at the University of Georgia , managed on Wall Street at Bear Stearns, was CEO of IP Group, and is a mentor. Bob currently resides in Delray Beach, FL where he cares for his mother, Dorothy, who suffers from Alzheimer's disease. Bob has written more than 500 articles with more than 11,000 links to his work on the Internet. His content has been syndicated on Reuters, the Wall Street Journal, Fox News, Pluck, BlogCritics, and a growing list of newspaper websites (15). Bob is actively seeking writing assignments and syndication.


Thursday, February 26, 2009

Food for thought on the Budget Deficit


One thing that is being overlooked in this budget deficit mess is payback. If these TARP loans get paid back the future deficits are likely to be better than is currently being forecast in the market.

New bull market down the road? Remember these factors always influence stock market action:
  • Perception
  • Better than expected
  • Consumer and investor confidence


Feel free to comment or share you thoughts on this and the budget deficit.

Follow EF Hutton on Twitter
Subscribe to EF Hutton via Email


Friday, January 09, 2009

CNBC Bonus Bucks Trivia Answers/ Financial Meltdown Revisted


Good morning. If you are wondering why you can't get the Bonus Bucks answer here right now--the CNBC contest website is not working. When it comes back up we will have the questions and answers.

If you have the time you can take a look at my post from September 15, 2008 about the impending financial disaster. When I posted the article the S & P 500 was trading around 1200.

Financial Meltdown--Where there is Smoke, there is Fire


Subscribe to EF Hutton via Email

Follow EF Hutton on Twitter

Financial Meltdown--Where there is Smoke, there is Fire


This article was originally written on September 15, 2008.

At dinner he described the situation to me. He said, “Where there is smoke there is fire”. He went on to explain that any time a major financial institution gets in trouble you could draw a circle around its location and expect the problem to spread to any other financial institution in a 150 mile radius (keep in mind this was the 1980s and before the Internet). He went on to explain the interconnectivity of financial institutions in a geographic proximity....His trip and fact finding mission convinced him that there was going to be a real financial crisis in Texas and that it would likely devastate the major banks and savings and loans. This was a very unpopular stance that cost him his job....It also was the catalyst of a stock market crash in 1987....I am reminded of other sayings that I heard early in my career on Wall Street—“never try and catch a falling knife”. I find myself thinking right now—“Cash is King”.


Financial Meltdown--Where there is Smoke, there is Fire

Back in the 1980s I learned an important lesson. At the time, I was with Bear Stearns and working in their Dallas, Texas office. The head of credit came to Texas to visit the state’s major banks and Savings and Loans to discuss their financial statements. Specifically he was trying to get a handle on their financial viability. There was a growing concern about the quality of credit and soundness of financial institutions in the southwest and California. The head of credit spent a couple of days in Dallas and Houston talking to the CFOs of these banks. Late in day, at the end of the trip, I saw him sitting alone in the office and asked him what he was doing. He informed me he was done but was not scheduled to fly out until the next morning. I saw this as an opportunity to “pick” his brain and learn something. So, I invited him out to dinner.

At dinner he described the situation to me. He said, “Where there is smoke there is fire”. He went on to explain that any time a major financial institution gets in trouble you could draw a circle around its location and expect the problem to spread to any other financial institution in a 150 mile radius (keep in mind this was the 1980s and before the Internet). He went on to explain the inter connectivity of financial institution is a geographic proximity. His trip and fact finding mission convinced him that there was going to be a real financial crisis in Texas and that it would likely devastate the major banks and savings and loans. This was a very unpopular stance that cost him his job. At the end of the day he was right. Both of the major banks in Dallas failed (Republic and First Interstate) and all of the major S and L’s in Texas failed (Sunbelt and Bright Bank to name two). This resulted in the formation of the Resolution Trust Corporation a government agency set up to dispose of the massive amount of defaulted loans owned by these financial institutions. It also was the catalyst of a stock market crash in 1987.

For years I have been telling my friends that the derivatives and swaps markets would turn out to be the equivalent of the savings and loan fiasco but on a scale that could never be imagined. Let me ask you, do you know anyone that predicted Bear Stearns, Lehman Brothers and AIG would go up in smoke? That Merrill Lynch would be offered at a fire sale? Have you heard prior discussions about the inter connectivity of all these financial institutions? Are they within a 150 mile radius?

AIG, the next to go, is a good example of the direness of the current situation. AIG has been racking up enormous profits for a very long time. Just last week they were considered to be solvent. They are loaded with cash. They are claiming $1,000,000,000,000 in assets (Trillion). They operate world wide. Now if you ask AIG they will tell you their problem is not a solvency issue it’s a liquidity issue. It seems that the financial community is no longer buying this argument and no one is willing to stand up and throw money at the problem. AIG does not have the necessary assets to collateralize the $75 billion in loans it needs right now to keep operating. If they go down someone will be on the hook for the insurance side of the business. I bet you thought as an insurance company there were being regulated. Partially true but this does not include the part of the business that is all wrapped up in the credit default swaps market and other derivatives designed to leverage the balance sheet and create “monster” profits. It appears the Fed and government regulators have finally decided that bailouts aren’t working and decided to say no to Lehman and AIG. Lehman is bankrupt and it appears that AIG will declare bankruptcy soon. The too big fail rule is no longer in effect.

It would be foolish to believe that once AIG goes over the cliff it will bring an end to the financial crisis we are seeing today. You should be thinking of the inter connectivity of AIG and all the counterparties they are doing business with AIG worldwide. Companies doing business with them will get wounded, maybe mortally wounded. What looked like a US problem is now a global problem. This will spill into financial markets world wide.

It appears it is finally being recognized that this is not smoke, it’s a FIRE. It appears that “too big to fail” is no longer a workable strategy to fix the problem. It appears the reality of the credit swaps derivatives market is finally being recognized. It’s likely that much of this paper is worthless or only worth cents on the dollar. This financial crisis is not likely to go away over night. There is more to come before all this “paper” can get unwound or find a home. In the interim there is an enormous risk in the stock and other financial markets.

The Fed will address this issue by adding massive liquidity to the markets. The world’s central banks will do the same. It is the right thing to do. But, it is a short term fix that is like prescribing an aspirin for a major infection. It might lower your fever but it won’t cure your illness.

In closing, I am reminded of other sayings that I heard early in my career on Wall Street—“never try and catch a falling knife”. But, right now I find myself thinking—“Cash is King”.

Wednesday, January 07, 2009

Pros Say: Buck Up — And Buy Upgraded Stocks!


An in-depth analysis of America's auto makers revealed startling details dating back at least five years, according to Disclosure Insight's John Gavin. He says General Motors suffered from persistent problems with internal controls; Ford did too, but has resolved most of them.
Subscribe to EF Hutton via Email


Pros Say: Buck Up — And Buy Upgraded Stocks!


The U.S. Congress convened Tuesday to deal with what many are calling the worst global economic crisis since the 1930s. Meanwhile, pending home sales slid to a 7-year low; and even Manhattan apartment prices — once considered economically sacrosanct — fell nearly 4 percent. Yet CNBC heard from optimistic experts who say stocks are the smart investment now, thanks to great Obama expectations and moves already made by the Federal Reserve and the Treasury.

Market Forecast: Sunny, With Rising Stock Prices

Rob Morgan of Clermont Wealth Strategies said he has raised his rating on stocks to market weight from underweight. Stocks are cheap and there is a lot of money on the sidelines; the ingredients are in place for a lot of good things to happen. JPMorgan Private Wealth Management's Anthony Chan said anticipation of a massive stimulus package and the effects of prior Fed actions are adding even more optimism.

Aaaaand We're Off: Fed Buying Begins

Kevin Ferry of Cronus Futures Management said market strategists will be focusing on two things for the near term: money supply, and what the Fed is buying. It's a big job, and the Fed has said it wants to be out of the market by June. The market is functioning again — he prefers the word "functioning" to "working" — and talk of credit being broken has finally quieted down.

GM: Gi-normous Mess?

An in-depth analysis of America's auto makers revealed startling details dating back at least five years, according to Disclosure Insight's John Gavin. He says General Motors suffered from persistent problems with internal controls; Ford did too, but has resolved most of them. GM CEO Rick Wagoner is too tied to the history of the company to be "sufficiently dispassionate" to change the company's business model.

Contrarian's Qualms: More Questions Than Answers

There's not a lot of substance behind the current optimism, according to First Principles Capital Management's Doug Dachille. The full effects of a new administration and the government's big moves a few months ago remain to be seen. And he says the foreign investors we're hoping will buy U.S. debt may instead focus resources to stimulate their own economies.

Not Out of the Woods — But Oil & Dollar Have Promise

Jason Roney of Sharmac Capital said he expects a "pretty solid test of last year's low" after an initial period of optimism as the year progresses. The presumption right now is that the worse the data gets, the better the Obama administration's stimulus package will be.
Rising oil prices point to an improving global economy, and the dollar's decline will be muted

as Europe rushes to catch up with U.S. rate-cutting.

_________________________________
CNBC Investor Tools:
# The CNBC Stock Blog
# Oil, NatGas, Gold Prices
# Dollar vs Euro, Pound, Russian Rouble

________________________________
CNBC's Companies in the News:

General Motors

Apple

General Electric*
*GE is the corporate parent of CNBC.

Dow Chemical

Bank of America

________________________________
© 2009 CNBC.com

URL: http://www.cnbc.com/id/28523560/

According to the CNBC Stock Blog, which housing stock did strategist Ivy Zelman pan on Tuesday?


CNBC Bonus Bucks Trivia
CNBC Million Dollar Portfolio Challenge
Squawk Box

Question: According to the CNBC Stock Blog, which housing stock did strategist Ivy Zelman pan on Tuesday?

Answer: none of the above

Subscribe to EF Hutton via Email

Follow EF Hutton on Twitter

Three Housing Stock Picks — And 5 Pans

The promise of a stimulus package from the incoming Obama administration has raised hopes that the battered housing sector will soon be stabilized. That's encouraged investors to buy home builder stocks — but Ivy Zelman of Zelman and Associates warns that while some companies are promising, others are not.

"The homebuilders and building-product companies are trading on a hope rally right now," she told CNBC, but she played down ideas about quick stability in housing. "Unfortunately, we do not see that, and we would be selling into strength, into the rally, and selectively."

Recommendations:

Stock Picks:

"We like NVR ," she said. "We think it's the only company in this space that is an investment...as opposed to the other stocks that are more trading-oriented, and we do like a few names, like Lennar and Centex ."

Stock Pans:

Her list of homebuilding stocks to "be taken off the table" is a longer one: Pulte , KB Home , Toll Brothers , DR Horton , and Ryland .

"Those stocks have, in our opinion, shown a lot of the upside, given the optimism on the stimulus," she explained.

Disclosures:

Disclosure information for Ivy Zelman was not immediately available.l

Disclaimer

© 2009 CNBC.com
URL: http://www.cnbc.com/id/28502681/

Friday, January 02, 2009

On New Years Eve, Brent Wilsey told CNBC that which stock is in the "30% Club"?


CNBC Bonus Bucks Trivia
CNBC Million Dollar Portfolio Challenge

Squawk on the Street

Question: On New Years Eve, Brent Wilsey told CNBC that which stock is in the "30% Club"?

Answer: Cisco Systems

Subscribe to EF Hutton via Email


The 30% Club: Three Stocks With Promising Returns

Brent Wilsey has a simple guideline for the new year: He thinks investors should put their money into companies whose returns will improve at least 30 percent in 2009. Easier said than done, you say?

The president of Wilsey Asset Mangement is putting his mouth where his money is, and he says now is the time to move.

"I'd be afraid of missing it, in waiting too long," he told CNBC.

Recommendations:

He starts with Cisco Systems .

"Their sales have climbed one percent year-over-year, and debt's in check, very strong fundamentals," he said. "Estimates have come down, but you're still paying a lower price for those earnings."

He also likes NYSE Euronext .

"Keep in mind, the 52-week high in this stock was $88.62," he said. "If it climbs just halfway back to that level, you'll get over an 83 percent return on your investment."

Also on his list is the infrastructure play, Fluor .

"They do heavy construction, build roads, bridges," he explained. "This is a company with low debt; I think they'll benefit from the new administration."

Disclosures:

Disclosure information for Brent Wilsey was not immediately available.

Disclaimer
© 2008 CNBC.com

URL: http://www.cnbc.com/id/28449467/

Tuesday, December 30, 2008

Sneak Peek at Energy 2009


Forbes has a good article looking ahead at energy in 2009. Trends, Predictions and Investing Ideas.

A year ago the worry was that oil demand would outstrip supply. Today, the Saudis alone have more than 3.5 million bpd of spare production capacity.
Tailwinds will soon give alternative energy a boost in the form of the energy policies and subsidies from the incoming Barack Obama administration
Obama's energy plan calls for the "responsible domestic production of oil and natural gas." Translation: He'll focus on maximizing existing energy production on the Outer Continental Shelf, revise the Bush administration's 2007-12 drilling plan and reinstate the executive order banning offshore drilling.

Get some nice stock ideas while you are there.
Go read it

Subscribe to EF Hutton via Email

Tuesday, December 02, 2008

A Brief History of Stock Market Drops--the Last 80 years


Market Mayhem

There have been plenty of big selloffs in the stock market over the last month, but early on Friday Oct. 24, many market watchers thought it would bring the big one that would join other infamous days. For history's sake, however, the days since Lehman Brothers' chapter 11 have been momentous and notable enough. Here's a look at some very bad days and periods for stocks that got investors' attention over the past 80 years.

Crash of 1929
The stock market crash of 1929 saw the market fall 12.8 percent on Oct. 28, 1929, known as “Black Monday," but the market fell almost as sharply the day after. The crash contributed to the Great Depression of the 1930s and many also consider it part of a two-decade bear market.

1973-1974
During this period of the Nixon-Ford presidency, when inflation was a major concern because of the first oil spike, the Dow went from its Jan. 11, 1973 high of 1051.70 to a low of 577.60 on Dec. 6 1974, a 45.1 percent decline.

Oct. 19, 1987
Known as Black Monday, or "The Crash," the Dow fell 507.99 points, or 22.61 percent, as part of a broad global selloff.

Oct. 13, 1989
The failure of a leveraged buyout of airline holding company UAL triggered what was then known as the "Mini Crash." The Dow fell 190.58 points, a 6.91 percent decline.

1997
The financial crisis in Asia, primarily in South Korea, Indonesia and Thailand, had its largest impact on the US markets on Oct. 27, 1997 when the Dow dropped 554.26 points, 7.18 percent, forcing an early closing of the NYSE.

Dot-Com Bubble Burst
The tech sector was hit hard as the dot-com bubble burst. The Nasdaq peaked at 5048.62 on Mar. 10, 2000 before beginning a brutal two-month slide. By May 23, 2000, it was down 37.32 percent.

Sept. 17, 2001
The Dow dropped 684.81 points (7.12 percent) on Sept. 17, 2001, the Monday the New York Stock Exchange resumed trading for the first time after the 9/11 attacks.

Subscribe to EF Hutton via Email

Follow EF Hutton on Twitter