Showing posts with label chart. Show all posts

Saturday, October 17, 2009

Industrial Production -- Five Year Chart


Industrial Production and Capacity Utilization, Monthly
Subscribe to All American Investor via Email

Kindle: Amazon's 6" Wireless Reading Device
Subscribe to EF Hutton via Email
Follow E F Hutton on Twitter

Kindle: Amazon's 6" Wireless Reading Device

Saturday, September 05, 2009

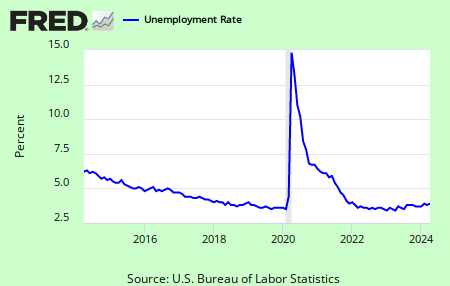
Unemployment Trend Remains UP (Graph)


Savvy investors understand that the market usually bottoms and turns up long before unemployment peaks. In other words, the market discounts the bad news in advance. So it is easy to understand how the market can rally in spite of the negative unemployment report.

There has not been much discussion about the number of people that are falling off the unemployment insurance payrolls each month. Another 1.5-2 million people will stop getting checks by the end of the year. Unless, of course, these benefits are extended. Additionally, the civilian labor force is dropping or the numbers would be much worse.

We will discuss the growing number of people that have been unemployed 27 weeks or longer, and the real unemployment rate shortly.

The uptrend in unemployment is still strong as evidence by this chart.

Subscribe to All American Investor via Email
Bob DeMarco is a citizen journalist and twenty year Wall Street veteran. Bob has written more than 700 articles with more than 18,000 links to his work on the Internet. Content from All American Investor has been syndicated on Reuters, the Wall Street Journal, Fox News, Pluck, Blog Critics, and a growing list of newspaper websites. Bob is actively seeking syndication and writing assignments.

Kindle: Amazon's 6" Wireless Reading Device


Original content Bob DeMarco, All American Investor

Friday, August 07, 2009

Unemployment A Picture Worth a Thousand Words (Graph)


Civilian Unemployment Rate (Percent).

You tell me. Glass half full, glass half empty?


Subscribe to EF Hutton via Email
Follow E F Hutton on Twitter

Kindle: Amazon's 6" Wireless Reading Device

Saturday, August 01, 2009

Reserve Bank Credit Dropping are Higher Interest Rates on the Near Term Horizon? (Graph)


Reserve Bank Credit is peaking. Reserve credit is down from the peak of $2,236 billions during December, 2008, the secondary top at $2,165 billions during May, 2009. The current reading is $2,010 billions.

This series should be watched closely. The current drop in the dollar could force the Federal Reserve to continue draining reserves from the system to protect the dollar from an all out free fall.

This will likely lead to an increase in long term interest rates. However, it is time to start watching the two year treasury security closely.


Note: Reserve Bank credit is the sum of securities held outright, repurchase agreements, term auction credit, other loans, net portfolio holdings of Commercial Paper Funding Facility LLC, net portfolio holdings of LLCs funded through the Money Market Investor Funding Facility, net portfolio holdings of Maiden Lane LLC, net portfolio holdings of Maiden Lane II LLC, net portfolio holdings of Maiden Lane III LLC, float, central bank liquidity swaps, and other Federal Reserve assets.
Subscribe to EF Hutton via Email
Follow E F Hutton on Twitter

Kindle: Amazon's 6" Wireless Reading Device

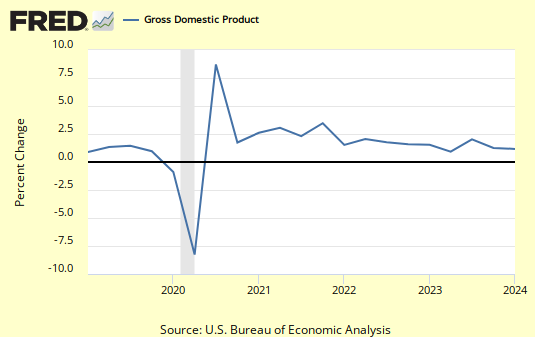
Gross Domestic Product Percent Change (Chart)


Gross Domestic Product, 1 Decimal, Quarterly, Billions of Dollars, Seasonally Adjusted Annual Rate.

Bar Chart, Percent Change

$14,149.8 Billions versus $14,497.8 a year ago.

Subscribe to EF Hutton via Email
Follow E F Hutton on Twitter

Kindle: Amazon's 6" Wireless Reading Device

Friday, July 31, 2009

Four Week Average of Initial Unemployment Claims (Chart)


The four week moving average of unemployment claims continues to drop.

This week's average of 559,000 compares to 616,00 a month ago.

Subscribe to All American Investor via Email
Kindle: Amazon's 6" Wireless Reading Device

Monday, July 20, 2009

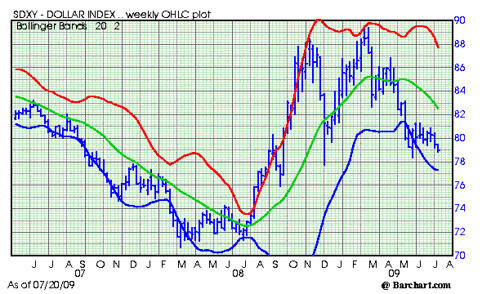
Dollar Index Approaching Near Term Support and Lows (Chart)


Subscribe to EF Hutton via Email

The Dollar Index (DI) is approaching its near term low of 78.34 made back in June, and 77.68 in December.

Back in March, a breakdown in the DI signaled a big break in the stock market. Will history repeat itself?

THE DI is a somewhat oversold here, so it should hold in short term.

This area and the resulting trade should be watched closely by investors.

The DI traded down to 70.69 in March.

Dollar Index Weekly Chart

Dollar Index Weekly Chart 720


Kindle: Amazon's 6" Wireless Reading Device

Sunday, July 19, 2009

30 Year Mortgage Interest Rate (Conventional, Graph)


Subscribe to EF Hutton via Email


Kindle: Amazon's 6" Wireless Reading Device

Thursday, July 09, 2009

4 Week Average of Unemployment Claims Drops (Chart)


The 4 week moving average of initial claims for unemployment dropped to 606,000 versus 616,000 a week ago. The 4 week average has been over 600,000 since February, 2009.


Kindle: Amazon's 6" Wireless Reading Device
Subscribe to EF Hutton via Email
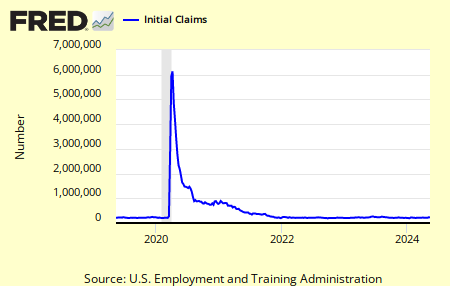
Initial Claims for Unemployment Tick Up (Graph)


Current reading 577,506 versus 559,894 a week ago.


Bob DeMarco is a citizen journalist and twenty year Wall Street veteran. Bob has written more than 500 articles with more than 11,000 links to his work on the Internet. Content from All American Investor has been syndicated on Reuters, the Wall Street Journal, Fox News, Pluck, Blog Critics, and a growing list of newspaper websites. Bob is actively seeking syndication and writing assignments.


Kindle: Amazon's 6" Wireless Reading Device

Saturday, July 04, 2009

Unemployed for 27 Weeks Plus Now 4.3 Million and Growing Fast (Graph)


This chart covers the last five years. Currently 4.3 million versus 1.6 in June,2008. Up 40 percent since January, 2009 (1.7 million). 4.3 million is a new all time high and is up 433,000 in the last month.


1948 to the Present. Currently 4.3 million versus the previous high of 2.8 million, June, 1983.


This does not bode well for those expecting a quick turnaround in the economy. If the trend continues it could cause double dip recession.

Kindle: Amazon's 6" Wireless Reading Device

Thursday, July 02, 2009

Real Unemployment Soars to 16.8 Percent (Statistics, Graph)


If you read Table 12 in the Bureau of Labor Statistics report you learned the real unemployment rate is 16.8 percent, not 9.5 percent.

Few people are familiar with the U-6 report that is issued by the United States Department of Labor-- Bureau of Labor Statistics. The U-6 (Table A-12: Alternative measures of labor under utilization) measures the real rate of unemployment in the United States.

Most news organizations report the more popular U.S. Department of Labor: Civilian Unemployment Rate. If you read the report today you learned that unemployment is 9.5 percent for June.

If you read the U-6 you learned the real rate of unemployment is 16.8 percent versus 10.3 percent in June 2008. To view this report and the numbers go here.

Real Unemployment U-6 -- 16.8%
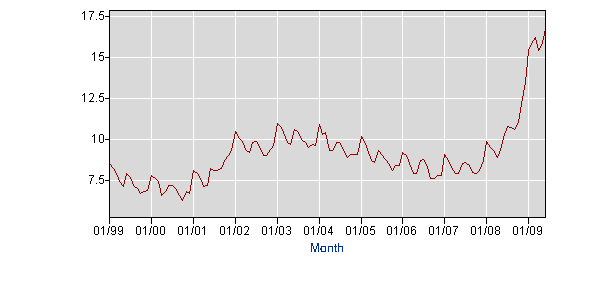
Real Unemployment June
There are other groups of unemployed that are not counted in the more popular employment report. The Bureau of Labor Statistics U-6 report includes the unemployed, and those that have thrown in the towel.

The U-6 report includes:

  • Total unemployed
  • plus all marginally attached workers
  • plus total employed part time for economic reasons

In other words,

  • marginally attached workers are persons who currently are neither working nor looking for work, but indicate that they want and are available for a job, and have looked for work sometime in the recent past.
  • Discouraged workers, a subset of the marginally attached, have given a job-market related reason for not looking currently for a job.

The U-6 report counts everyone that is unemployed--officially and unofficially.

Here are some other statistics that you might find disconcerting.
  • About 2.2 million persons (not seasonally adjusted) were marginally attached to the labor force in June. 618,000 more than a year earlier. These individuals wanted and were available for work, and had looked for a job sometime in the past 12 months. They were not counted as unemployed because they had not searched for work in the 4 weeks preceding the survey.
  • Among the marginally attached, there were 793,000 discouraged workers in June, up by 373,000 from a year earlier.
  • In June, the average workweek for production and nonsupervisory workers on private nonfarm payrolls fell by 0.1 hour to 33.0 hours--the lowest level on record for the series, which began in 1964.
  • The number of long-term unemployed (those jobless for 27 weeks or more) increased by 433,000 over the month to 4.4 million.
  • In June, 3 in 10 unemployed persons were jobless for 27 weeks or more.

This morning the stock market reacted negatively to this report. If you are wondering why--all you need to do is look beyond the obvious. This is what this website is all about.

These numbers do not bode well for stocks and indicate at best, we are looking at slow growth in the months ahead.

All of the statistics in this article were sourced from the Department of Labor--Bureau of Labor Statistics.

Subscribe to All American Investor via Email

Bob DeMarco is a citizen journalist and twenty year Wall Street veteran. Bob has written more than 700 articles with more than 18,000 links to his work on the Internet. Content from All American Investor has been syndicated on Reuters, the Wall Street Journal, Fox News, Pluck, Blog Critics, and a growing list of newspaper websites. Bob is actively seeking syndication and writing assignments.


More from All American Investor


Follow All American Investor on Twitter

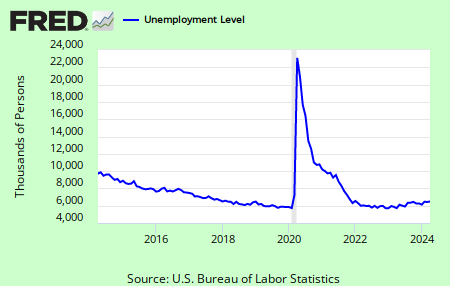
Number of Unemployed Reaches 14.7 Million (Chart)


U.S. Department of Labor: Bureau of Labor Statistics


Kindle: Amazon's 6" Wireless Reading Device

Capacity Utilization (Graph)


This graph, a lagging indicator, tells us the economy is in for a long period of slow growth.

When people are sitting around on the beach, instead of working, this is not a sign of the "good old days".

PMI Composite Index (ISM, NAPM, Graph)


Subscribe to EF Hutton via Email

Kindle: Amazon's 6" Wireless Reading Device

Net Free or Borrowed Reserves


The series is calculated by the Federal Reserve Bank of St.Louis.
Subscribe to EF Hutton via Email


Bob DeMarco is a citizen journalist and twenty year Wall Street veteran. Bob has written more than 500 articles with more than 11,000 links to his work on the Internet. Content from All American Investor has been syndicated on Reuters, the Wall Street Journal, Fox News, Pluck, Blog Critics, and a growing list of newspaper websites. Bob is actively seeking syndication and writing assignments.


Follow E F Hutton on Twitter

Kindle: Amazon's 6" Wireless Reading Device

Monday, June 22, 2009

Real Unemployment: 14 Million Americans Now Unemployed (Graphs)


Last week two popular measures of unemployment were reported: weekly unemployment claims (608,000) and the four week moving average of unemployment (615,750). Both showed that the number of people applying for unemployment insurance had dropped week over week.


The previous week another popular measure of employment --the civilian unemployment rate--jumped to 9.4 percent from 8.9 percent.

One number that is rarely reported in the popular media is the actual number of people that are unemployed. You might be shocked to learn that the number of unemployed workers soared to 14.5 million in the most recent report. This compares to 13.72 million the previous month, and 8.5 million a year earlier.

Source: The Employment Situation--Unemployed


While the more popular reports seem to be indicating that the employment situation is improving, the raw numbers show that more and more Americans are out of work. In fact, this is the largest number of unemployed since they started compiling this statistic in 1948.

Another sobering statistic is the number of Americans that have been unemployed for 27 weeks or longer. This number rose to 3.95 million in the latest period, versus 3.68 million a month earlier. In 2008, the number for the comparable period was 1.57 million.

Source: Civilians Unemployed for 27 Weeks and Over


These numbers are particularly disconcerting because many of these Americans have exhausting their Federal and State unemployment insurance benefits.

With the trend of unemployment still rising and the duration of unemployment still rising, the situation is more dire than it appears on the surface.

Many of the so called experts continue to say that the employment situation is improving based on weekly unemployment claims report. The evidence (although lagging) paints a very different picture of employment in America.

Those investing in stocks should take a good hard look at these numbers. The numbers are telling us that the economy is still at risk.

While the employment situation might not be as bad as it was a few months ago, the situation is still very negative.

It is often true that the stock markets discounts all the bad news before it happens. But the question still remains, has the market discounted the worst of the news, or is the worst news still to come?
Subscribe to All American Investor via Email

Bob DeMarco is a citizen journalist and twenty year Wall Street veteran. Bob has written more than 700 articles with more than 18,000 links to his work on the Internet. Content from All American Investor has been syndicated on Reuters, the Wall Street Journal, Fox News, Pluck, Blog Critics, and a growing list of newspaper websites. Bob is actively seeking syndication and writing assignments.


More from All American Investor


Follow All American Investor on Twitter

Friday, June 19, 2009

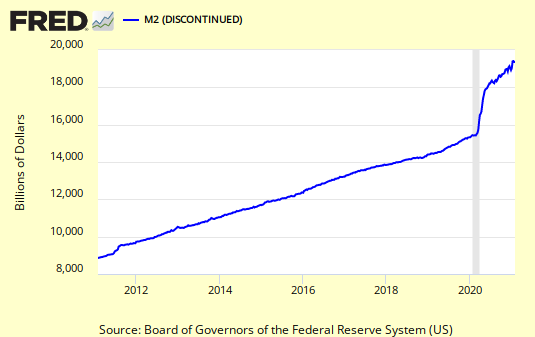
Money Supply Climbs to New High (M2, Graph)


Subscribe to EF Hutton via Email

Bob DeMarco is a citizen journalist and twenty year Wall Street veteran. Bob has written more than 500 articles with more than 11,000 links to his work on the Internet. Content from All American Investor has been syndicated on Reuters, the Wall Street Journal, Fox News, Pluck, Blog Critics, and a growing list of newspaper websites. Bob is actively seeking syndication and writing assignments.


Follow E F Hutton on Twitter

Kindle: Amazon's 6" Wireless Reading Device