Showing posts with label technical. Show all posts

Tuesday, June 02, 2009

Gold | Fourth Time Up the Charm (Chart)


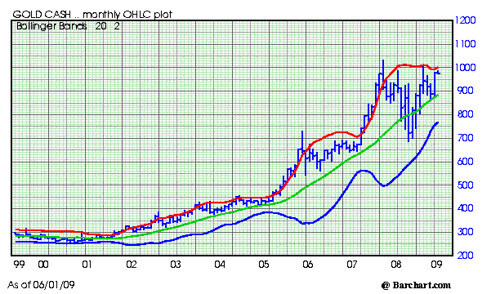
Gold, Cash, Monthly, Chart


There is a saying in technical trading that the fourth time up is the charm.

As you can see by looking at the Gold Chart, this is the fourth time up.

I am a little surprised by the rise in Gold at this time of year.
  • The more normal seasonal pattern is for Gold to peak in February - March.
  • After the seasonal peak, Gold normally trades down into the August - October period.
  • The strongest trading period for Gold normally occurs from October into March.
  • The seasonal pattern tells me that Gold is likely to take a rest.
  • On the other hand, the market looks very strong, technically, right now.
Previously, we mentioned the strong support in the 865-875 area. The market found willing buyers at that level and an interim low was made. We then mentioned that a close over the 927.50 area would likely send the market higher. This happened.

A close in Gold over 1,067.50 is likely to lead to an explosive up leg in gold. I am expecting this to happen, and the rise could very well be much higher than is currently being forecast by most.

I wrote previously about how I expect the buying of Gold out of Hong Kong to be enormous once the bull leg gets underway.

Back in the bull market of 1978 - 1980, Gold was often up sharply at the U.S. open based on large buying out of Hong Kong. Buying power from the China mainland should be a major factor in the price of gold in the year ahead. The buying is already picking up some momentum.

My experience tells me Gold is due for another correction back toward the 925 area -- the typical seasonal pattern. On the other hand, a break above this existing top could lead to a monster rally.

Long term gold traders should be patient and let it happen. Buyers of Gold stocks should see gains like they have rarely seen in the year ahead.
Subscribe to All American Investor via Email

Bob DeMarco is a citizen journalist and twenty year Wall Street veteran. Bob has written more than 500 articles with more than 11,000 links to his work on the Internet. Content from All American Investor has been syndicated on Reuters, the Wall Street Journal, Fox News, Pluck, Blog Critics, and a growing list of newspaper websites. Bob is actively seeking syndication and writing assignments.


More from All American Investor


Kindle: Amazon's Wireless Reading Device (Latest Generation)

Monday, April 13, 2009

S and P 500 Chart Update, Trend Intact


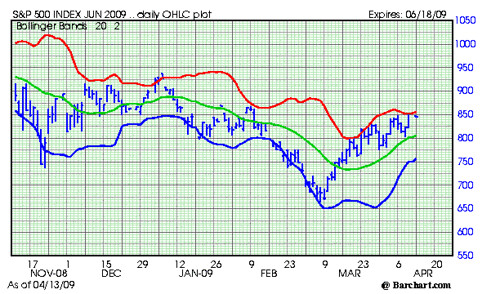
June S and P 500 Future, Chart, April 13, Pre Opening

June S and P 500 Chart 413

Notes:
  • Once again we bounced off the red line (plus two standard deviations) on Friday.
  • The market continues to attach to the red line during the rally.
  • The market continues to make higher highs and higher lows. A positive.
  • The uptrend remains intact. The lines continue to rise and are containing the market.
  • Retracements can come at any time.
  • Expect hard resistance on any rallies toward 860 today.
  • Support is rising, but still down to 800.
Subscribe to EF Hutton via Email


Bob DeMarco is a citizen journalist and twenty year Wall Street veteran. Bob has written more than 500 articles with more than 11,000 links to his work on the Internet. Content from All American Investor has been syndicated on Reuters, the Wall Street Journal, Fox News, Pluck, Blog Critics, and a growing list of newspaper websites. Bob is actively seeking syndication and writing assignments.


Follow E F Hutton on Twitter


Thursday, April 09, 2009

Stocks the Nervous Norvis Market (Chart and View)


There are a lot of Nervous Norvises out there.

When the market moves down for a couple of days your typical Nervous Norvis bull gets sweaty palms and heart palpitations. A couple of days down and the bears are pounding their chest. The only thing the bears can think about is bad news. Left to wonder of course, why is the market going up with all this bad news--the world is coming to an end.

Stocks the Nervous Norvis Market

The Stock market is in a classic uptrend from the capitulation low.

Review:
At the moment:
  • The market continues to make higher lows. The most important ingredient of a trend.
  • The market found support on a dip three times. This indicates there are buyers below the market. This is necessary to raise confidence.
  • Bears continue to try and sell the market. The big difference they are running for cover at the first sign of strength.
  • The slope of the green line (midpoint, support) continues to point up and is strengthening.
  • The blue line is picking up momentum and as long as this continues it will help propel the market higher,
  • The market is once again approaching the red line (two standard deviations up) and this should be watched. Short term traders should resist the urge to buy the market when it is at, near, or above the red line. This is where nervous norvises really get killed.
  • There is still substantial resistance from 850-875. This is where the market will likely wear out bulls who lack patience. They will get out and will likely start chasing it right into the top and before the next major test of the downside.
Subscribe to EF Hutton via Email


Bob DeMarco is a citizen journalist and twenty year Wall Street veteran. Bob has written more than 500 articles with more than 11,000 links to his work on the Internet. Content from All American Investor has been syndicated on Reuters, the Wall Street Journal, Fox News, Pluck, Blog Critics, and a growing list of newspaper websites. Bob is actively seeking syndication and writing assignments.


Follow E F Hutton on Twitter


Sunday, April 05, 2009

S & P 500 Up 24.53 Percent in 20 Days (Chart)


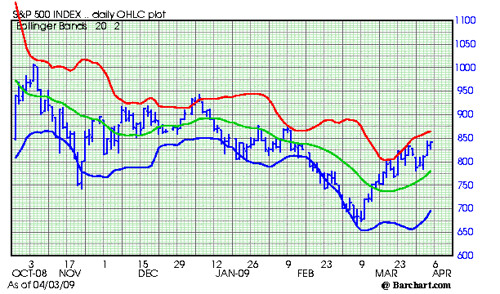
S and P 500 Chart
  • The S and P 500 has risen 24.53 percent in the last 20 trading days (close only).
  • The S and P closed at 842.50 on Friday.
  • There is substantial overhead resistance beginning at 850, all the way up to 875.
  • Resistance, as measured by the red line (two standard deviations, up) is around the 865 area and is flattening but still moving up.
  • Hard support is now well below the market around the 780 area. The slope of the green line (mid point of the range) continues to slope up. This is a positive.

S and P 500 Daily Chart 405
Subscribe to All American Investor via Email


Bob DeMarco is a citizen journalist and twenty year Wall Street veteran. Bob has written more than 500 articles with more than 11,000 links to his work on the Internet. Content from All American Investor has been syndicated on Reuters, the Wall Street Journal, Fox News, Pluck, Blog Critics, and a growing list of newspaper websites. Bob is actively seeking syndication and writing assignments.

Follow All American Investor on Twitter

More from All American Investor


Sunday, March 22, 2009

S and P 500 Weekly Chart


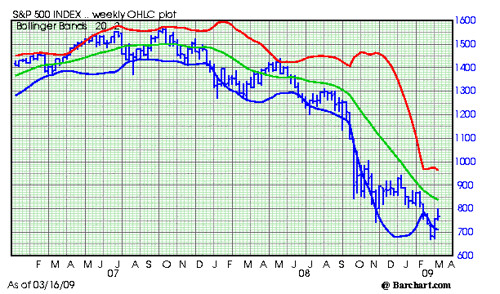
S an P 500 Weekly Chart March


On March 7, we posted the Monthly chart of the S and P 500 and pointed out the slope of the market was unsustainable and that a rally was likely. From that article,
You can see the slope of the market is very severe. This cannot be sustained much longer. When a market index trades down at a sharp angle like the one above (See March 7 chart), the market always rallies sharply when it reverses directions. This rally could start at any time.
Since then, we had two weeks up in the market as shown in the weekly chart above.

Now the question is what next? Technically this is a difficult question to answer. I would say this week is fifty-fifty. As you can see, the downtrend is still intact. The market is now above the blue line which indicates the severe oversold condition is not over. Overall, it is always more risky to be a buyer when the trend of the market is down--so it is still a time to be very cautious. I would also so, at this point the easy money has already been made on the downside. Toss up.

My best guess right now is that market is going to continue to consolidate and move sideways in the area between 663 and 800 before it makes its next move. On the fundamental side, I will be posting a new article entitled, Don't Fight the Tape, which makes an argument for additional upside in the market.
Subscribe to EF Hutton via Email
Bob DeMarco is a citizen journalist and twenty year Wall Street veteran. Bob has written more than 500 articles with more than 11,000 links to his work on the Internet. Content from All American Investor has been syndicated on Reuters, the Wall Street Journal, Fox News, Pluck, Blog Critics, and a growing list of newspaper websites. Bob is actively seeking syndication and writing assignments.

Saturday, March 21, 2009

Dollar Index Turning Down (Chart and Analysis)


Dollar Index March 2009


After the Treasury announcement this week, the dollar index traded sharply lower. Along with this, oil and commodity prices moved higher as should be expected.

The market is currently in a downside range expansion. The sharp trade below the blue line (two standard deviations down from the mid point) indicates that the market is oversold and due for a correction or consolidation on a short term basis. If the dollar index fails to regain the 84.00 level and hold, it would be a major negative. The trend is turning down.

The longer term chart of the Dollar Index indicates a major double top with an extended right top that found no new buyers. This is potentially extremely negative. We will put that chart up tomorrow with some analysis.
Subscribe to EF Hutton via Email

Wednesday, March 11, 2009

S and P 500 usually a good sale after two days UP


It is not unusual for a severely down sloped market to see a sharp two day contra trend rally. We are seeing that right now in the S and P 500.

Savvy short term traders should look to sell any rally into the 740-750 range on Wednesday night or Thursday. It is always a good idea to sell after two days up in a downtrend. Remember to limit your risk.

The inside day after the bottom, followed by a hook up does warrant some caution. It is possible that we could see an extension of the rally after a short pop down. The more significant resistance in this down trend is up above 800 right now.

The down trend remains intact. Those selling rallies in this monster downtrend that started in September have done very well. However, the downtrend has been in force for several months, and has come a long way. As the S and P 500 extends to the downside, selling the market becomes more risky. The easy money has been made on the short side time for the time being. Johnny come lately traders should keep this in mind. Savvy traders should be taking less risk in their trades at this point. This is not the time to get greedy or to get carried away with the madness of the crowd.


Subscribe to EF Hutton via Email

Bob DeMarco is a citizen journalist and twenty year Wall Street veteran. Bob has written more than 500 articles with more than 11,000 links to his work on the Internet. Content from EF Hutton has been syndicated on Reuters, the Wall Street Journal, Fox News, Pluck, Blog Critics, and a growing list of newspaper websites. Bob is actively seeking syndication and writing assignments.


Follow E F Hutton on Twitter


Monday, March 02, 2009

Technician Forecasts 600 Market Bottom for S and P 500 Index


Do we have a tech "guru" in the house. How about a Gann expert?

I didn't actually hear this first hand, I read it on the Internet.

A technician at Credit Suisse is forecasting a market bottom for the S and P 500 with a target price of 600-605.

I took a look at the market and I can see where he is getting this. Back in 1995 after breaking the 600 level for the first time the S and P went back and forth against that level for about a year and a half. Looking at the chart, 650 also looks like a formidable area. We could hit either or both of these areas this week.

I can't find my tech "guru" but 603 also looks like a Fibonacci number and a possible reversal point.

Do we have a tech "guru" in the house? How about a Gann expert?

What do you think?

I picked up this thread on Across the Curve.
clipped from charts.barchart.com
Chart for S&P 500

blog it


Subscribe to EF Hutton via Email


Bob DeMarco is a citizen journalist, blogger, and Caregiver. In addition to being an experienced writer he taught at the University of Georgia , was an Asociate Director and Limited Partner at Bear Stearns, was CEO of IP Group, and is a mentor. Bob currently resides in Delray Beach, FL where he cares for his mother, Dorothy, who suffers from Alzheimer's disease. Bob has written more than 500 articles with more than 11,000 links to his work on the Internet. His content has been syndicated on Reuters, the Wall Street Journal, Fox News, Pluck, BlogCritics, and a growing list of newspaper websites (15). Bob is actively seeking syndication and writing assignments.


Monday, February 23, 2009

Stocks: Down side range expansion continues--good trade opportunity


The downside range expansion continues and all systems indicate that market is going lower. You will notice the spike down to the 741 area in November. Will history repeat itself? I think to some extent it will. Traders should be on their toes for any spike below 741 overnight or early Tuesday morning.

I doubt we will see the monster rally we saw in November. But, looks good for a nice fat trade.

Complacent longs are still in the market and so far they have not capitulated. Sometime soon, very soon they are going to cry "Uncle".
clipped from charts.barchart.com

Chart for S&P 500

blog it


Subscribe to EF Hutton via Email
Any price action below 741 on Tuesday should show excellent resilience. The market should hold downside thrusts very well below 737.

Under 740 tomorrow favors quick, long side trades. If the market can muster a two day rally, it should be ready to start down with a vengeance. The market rarely closed lower 7 days in a row. These are rare times, however


More from All American Investor


Friday, February 20, 2009

Stocks Ready to Head down as Range Expands


If you would like to see more information like this consider signing up for the email list or for the RSS feed. If I find that people are interested in this kind of information I will spend more time putting it up.
clipped from charts.barchart.com
Chart for S&P 500
blog it


The chart above is a bar chart of the the S and P 500 index (cash). The green line is the twenty day moving average. The blue and red lines represent two standard deviations below and above the mean. When the market exceeds the red or blue line the market is overextended--oversold or overbought.

Right now, the market is oversold intraday--price below 777.00. As it a result, baring a disaster scenario, the market is likely to support at prices below this line today.

You should notice that the blue and green line are getting farther apart. Most times this indicates two things:
  • the market is likely to get more volatile
  • and, the range that the market is going to trade is expanding.
When the market range expands it becomes likely that the market is going to move up and down rapidly and the intraday trading is going to become more frenzied. This explain why markets often have violent rallies or dips that go against the trend of the market.

Right now, the blue line is sloping down at about ten points a day and is increasing--bad news. This means the market could be getting ready to make a new major move to the downside. In a scenario like this you should avoid two things.

  • First, when the market is below the blue line resist the temptation to go short. More often than not you will get killed.
  • Two, unless you are an excellent trader resist the temptation to buy the market for a position trade.
From a technical point of view the market appears to be turning down. Some people tend to think when the market gets oversold it is a sign that the market is going up. This is often true for a very short period of time. But, when a market is oversold more often than not it means the market is going to keep going in that directions until it finds a level of homeostasis.

My point. From a technical point of view the market is rolling over and weakening. When a market turns down the likelihood that it can go a lot lower increases dramatically. If the market is in a downtrend it will usually rally hard on good news and then drop right back down like a lead stone. Of course, if the market were to drop hard right this minute, it would likely bounce up nicely because it would be more than 2 standard deviations below the line---a statistical level that indicates the market has moved too far in that direction--short term.

You might also notice that the S and P has held the 800 level for months. The only exception to this was in November when it spiked down and then spiked right back above 800. This time around it has breached the 800 level and no longer is showing technical resiliency.

The market appears to be ready to go a lot lower. So it is a good time to be very cautious with your investments.

This is not an offer to buy or sell. I could be buying or selling the market at any time. The above examples are purely informational. I am not recommending anything. Buy, sell, or invest in the market at your own risk.

More from All American Investor