Showing posts with label crash. Show all posts

Friday, March 06, 2009

Are Mutual Funds Getting Ready to Capitulate?


Rumors are starting that a couple of mutual funds are in trouble. I can't confirm or deny at the moment.

Earlier this week I wrote about the increase in investors calls to both Vanguard and T. Rowe Price. See Investors pull $33 Billion out of Market.

When investors get scared, and they can't take it anymore, they often dump all their stocks. A form of the madness of the crowd--they sometimes do this in unison. Imagine 100,000s of investors all pushing the panice button at the same time. There are somewhere in the neighborhood of 88 million investors in the United States.
Could we be on the verge of a market capitulation?

See: Market Capitulation Means Big Opportunity to Make Money and S an P Support 659 and dropping, Market Capitulation?
Subscribe to EF Hutton via Email


Bob DeMarco is a citizen journalist, blogger, and Caregiver. In addition to being an experienced writer he taught at the University of Georgia , was an Asociate Director and Limited Partner at Bear Stearns, was CEO of IP Group, and is a mentor. Bob currently resides in Delray Beach, FL where he cares for his mother, Dorothy, who suffers from Alzheimer's disease. Bob has written more than 500 articles with more than 11,000 links to his work on the Internet. His content has been syndicated on Reuters, the Wall Street Journal, Fox News, Pluck, BlogCritics, and a growing list of newspaper websites (15). Bob is actively seeking syndication and writing assignments.


Tuesday, December 02, 2008

A Brief History of Stock Market Drops--the Last 80 years


Market Mayhem

There have been plenty of big selloffs in the stock market over the last month, but early on Friday Oct. 24, many market watchers thought it would bring the big one that would join other infamous days. For history's sake, however, the days since Lehman Brothers' chapter 11 have been momentous and notable enough. Here's a look at some very bad days and periods for stocks that got investors' attention over the past 80 years.

Crash of 1929
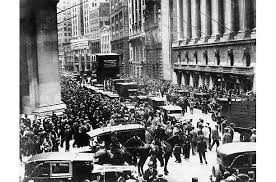
The stock market crash of 1929 saw the market fall 12.8 percent on Oct. 28, 1929, known as “Black Monday," but the market fell almost as sharply the day after. The crash contributed to the Great Depression of the 1930s and many also consider it part of a two-decade bear market.

1973-1974
During this period of the Nixon-Ford presidency, when inflation was a major concern because of the first oil spike, the Dow went from its Jan. 11, 1973 high of 1051.70 to a low of 577.60 on Dec. 6 1974, a 45.1 percent decline.

Oct. 19, 1987
Known as Black Monday, or "The Crash," the Dow fell 507.99 points, or 22.61 percent, as part of a broad global selloff.

Oct. 13, 1989
The failure of a leveraged buyout of airline holding company UAL triggered what was then known as the "Mini Crash." The Dow fell 190.58 points, a 6.91 percent decline.

1997
The financial crisis in Asia, primarily in South Korea, Indonesia and Thailand, had its largest impact on the US markets on Oct. 27, 1997 when the Dow dropped 554.26 points, 7.18 percent, forcing an early closing of the NYSE.

Dot-Com Bubble Burst
The tech sector was hit hard as the dot-com bubble burst. The Nasdaq peaked at 5048.62 on Mar. 10, 2000 before beginning a brutal two-month slide. By May 23, 2000, it was down 37.32 percent.

Sept. 17, 2001
The Dow dropped 684.81 points (7.12 percent) on Sept. 17, 2001, the Monday the New York Stock Exchange resumed trading for the first time after the 9/11 attacks.

Subscribe to EF Hutton via Email

Follow EF Hutton on Twitter

Friday, October 24, 2008

Circuit Breaker Halt Trading on the Dow Jones


The Dow Jones industrial average would have to fall 1,100 points on the day to trigger the first trading halt.

If that decline is reached before 2 p.m., the market will shut down for an hour. If the threshold is breached between 2 p.m. and 2:30 p.m., the halt will last 30 minutes. No trading stops would take place if the plunge occurs after 2:30 p.m.

If the index were to fall 2,200 points before 1 p.m., the market would close for two hours. If such a decline took place between 1 p.m. and 2 p.m., there would be a one-hour pause. The market would close for the day if stocks sank to that level after 2 p.m.

In the event of a 3,350-point decline, the market would close for the day, regardless of the time.

Thursday, July 10, 2008

Is the Hindenburg Omen forecasting a Stock Market Crash?


Stock traders are talking up the Hindenburg Omen. Is the Hindenburg Omen forecasting a stock market crash?

The Hindenburg Omen and the Criteria.

Or view a video over on the Two-Way Street Blog on CNBC

Criteria

The traditional definition of a Hindenburg Omen has five criteria:

* That the daily number of NYSE new 52 Week Highs and the daily number of new 52 Week Lows must both be greater than 2.2 percent of total NYSE issues traded that day.
* That the smaller of these numbers is greater than 75. (this is not a rule but a function of the 2.2% of the total issues)
* That the NYSE 10 Week moving average is rising.
* That the McClellan Oscillator is negative on that same day.
* That new 52 Week Highs cannot be more than twice the new 52 Week Lows (however it is fine for new 52 Week Lows to be more than double new 52 Week Highs). This condition is absolutely mandatory.

These measures are calculated each evening using Wall Street Journal figures for consistency. The occurrence of all five criteria on one day is often referred to as an unconfirmed Hindenburg Omen. A confirmed Hindenburg Omen occurs if a second (or more) Hindenburg Omen signals occur during a 36-day period from the first signal.