Showing posts with label weekly. Show all posts

Thursday, October 15, 2009

Real Average Weekly Earnings Fall


Real average hourly earnings fell 0.1 percent from August to September, seasonally adjusted, the Bureauof Labor Statistics reported today.

This decline stemmed from the Consumer Price Index for Urban Wage Earners and Clerical Workers (CPI-W), up by 0.2 percent, outpacing 0.1 percent growth in average hourly earnings for production and nonsupervisory workers.
Real average weekly earnings fell 0.4 percent over the month, as a result of the decrease in real average hourly earnings and a 0.3 percent decrease in the average work week. Since reaching a recent high point in December 2008, real average weekly earnings have fallen by 1.9 percent.
Subscribe to EF Hutton via Email
Follow E F Hutton on Twitter

Kindle: Amazon's 6" Wireless Reading Device

Thursday, June 04, 2009

Weekly Unemployment Claims May 30


In the week ending May 30,
  • the advance figure for seasonally adjusted initial claims was 621,000, a decrease of 4,000 from the previous week's revised figure of 625,000.
  • The 4-week moving average was 631,250, an increase of 4,000 from the previous week's revised average of 627,250.
  • The advance seasonally adjusted insured unemployment rate was 5.0 percent for the week ending May 23, unchanged from the prior week's revised rate of 5.0 percent.
  • The advance number for seasonally adjusted insured unemployment during the week ending May 23 was 6,735,000, a decrease of 15,000 from the preceding week's revised level of 6,750,000.
  • The 4-week moving average was 6,687,500, an increase of 88,750 from the preceding week's revised average of 6,598,750.
Subscribe to EF Hutton via Email


Bob DeMarco is a citizen journalist and twenty year Wall Street veteran. Bob has written more than 500 articles with more than 11,000 links to his work on the Internet. Content from All American Investor has been syndicated on Reuters, the Wall Street Journal, Fox News, Pluck, Blog Critics, and a growing list of newspaper websites. Bob is actively seeking syndication and writing assignments.


Kindle: Amazon's Wireless Reading Device (Latest Generation)

Monday, May 11, 2009

Duration of Unemployment Soars to New All Time High (Chart)


People are staying unemployed longer. Average duration of unemployment has lengthened by more than two weeks (20 percent) since January. This is the highest reading for this series on record.

Subscribe to EF Hutton via Email


Saturday, May 02, 2009

Dendreon (DNDN) Lightening Strikes Twice (Chart)


Dendreon (DNDN) Lightening Strikes Twice

Weekly Chart.

If you owned it, you had a shot to make 10 times your dojo.

65 day high 27.40. 65 day low 2.55.

Dendreon Weekly Chart 501

Amazing. Dendreon (DNDN) traded up like an oil gusher in 2007, high 25.25, and back down to 2.55 in March, 2009. It did it again this year, high 27.40.

What is next for Dendreon. Beats me, mighty risky for sure. Fundamental story is interesting. Feel free to add your two cents in the comments box.
Subscribe to All American Investor via Email


Follow All American Investor on Twitter

Sunday, March 22, 2009

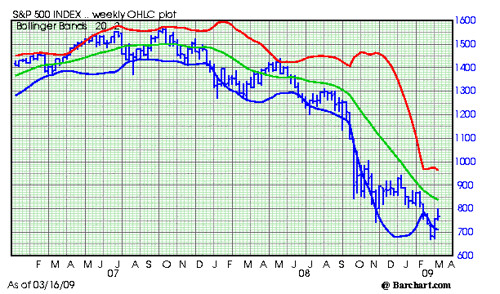
S and P 500 Weekly Chart


S an P 500 Weekly Chart March


On March 7, we posted the Monthly chart of the S and P 500 and pointed out the slope of the market was unsustainable and that a rally was likely. From that article,
You can see the slope of the market is very severe. This cannot be sustained much longer. When a market index trades down at a sharp angle like the one above (See March 7 chart), the market always rallies sharply when it reverses directions. This rally could start at any time.
Since then, we had two weeks up in the market as shown in the weekly chart above.

Now the question is what next? Technically this is a difficult question to answer. I would say this week is fifty-fifty. As you can see, the downtrend is still intact. The market is now above the blue line which indicates the severe oversold condition is not over. Overall, it is always more risky to be a buyer when the trend of the market is down--so it is still a time to be very cautious. I would also so, at this point the easy money has already been made on the downside. Toss up.

My best guess right now is that market is going to continue to consolidate and move sideways in the area between 663 and 800 before it makes its next move. On the fundamental side, I will be posting a new article entitled, Don't Fight the Tape, which makes an argument for additional upside in the market.
Subscribe to EF Hutton via Email
Bob DeMarco is a citizen journalist and twenty year Wall Street veteran. Bob has written more than 500 articles with more than 11,000 links to his work on the Internet. Content from All American Investor has been syndicated on Reuters, the Wall Street Journal, Fox News, Pluck, Blog Critics, and a growing list of newspaper websites. Bob is actively seeking syndication and writing assignments.

Monday, January 12, 2009

CNBC Weekly Bonus Quiz


CNBC Weekly Bonus Quiz

If the S&P 500 goes down 1%, how much does SDS go up?

Answer: 2 %
Subscribe to EF Hutton via Email

Follow EF Hutton on Twitter

Monday, December 01, 2008

Calls give you the right to?


CNBC Bonus Bucks Trivia Answers
CNBC Million Dollar Portfolio Challenge

Weekly Quiz
Calls give you the right to?
Answer: Buy the stock at the strike price


Subscribe to EF Hutton via Email