Showing posts with label technical analysis. Show all posts

Sunday, April 26, 2009

Conoco Phillips (COP) great yield, great chart


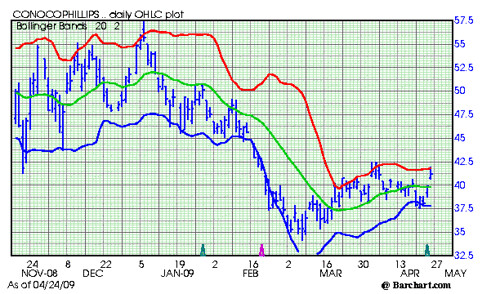
Conoco Phillips (COP) yields 4.60 percent. The chart looks good and a close over 42.50 would confirm the change in trend. The stock traded near 57.50 on January 9. I started thinking about this stocks after hearing Jim Cramer tout it on Mad Money.

Conoco Phillips 426
Subscribe to EF Hutton via Email
Bob DeMarco is a citizen journalist and twenty year Wall Street veteran. Bob has written more than 500 articles with more than 11,000 links to his work on the Internet. Content from All American Investor has been syndicated on Reuters, the Wall Street Journal, Fox News, Pluck, Blog Critics, and a growing list of newspaper websites. Bob is actively seeking syndication and writing assignments.


Tuesday, April 21, 2009

Google Downside Reversal? (Chart)


On Friday morning, I wrote Google Upside Blow Off. It appeared to me that Google was blowing off to the upside and that a short squeeze was taking place. Friday's close was also suspicious.

Action today could be signaling a downside reversal in Google. So far the low is in the critical 380 area. If 380 is breached it would signal additional downside in Google.

Short term investors should be extremely careful. Longer term investors need to be watching closely for a change in trend.
Subscribe to EF Hutton via Email


Wednesday, April 01, 2009

S & P 500 Stress Test for the Bears


S and P 500, Chart, Daily, Midday.

S & P 500 Stress Test

Highlights:
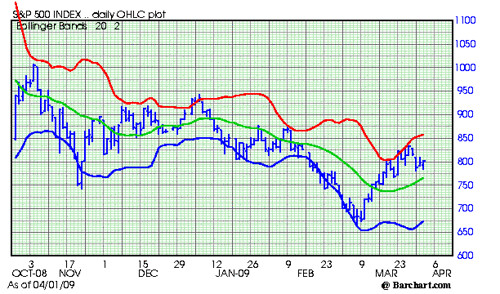
  • It is early in the day but the market made a new low, below yesterday's low, reversed, and is now clawing its way back over 800. A positive short term development.
  • The chart gap is still in play. The S & P needs to trade to 813.43 to fill the gap. This area should be watched closely.
  • Trading is slow so far. However, it the market closes above that gap the bears will be forced to run for cover.
  • A close above yesterday's high of 810.48 would give us an outside up day. That would be very bullish. It would also give us another hook up in the chart.
  • We need to watch closely to be sure support is building below the market. A pattern of higher highs and higher lows is what we are looking for to remain bullish.
In spite of all the bear chatter and shorting in the market, the S and P is only 30 points from the high for this move--made last week. A move above yesterday's high will put extreme pressure on the bears.

Looks like a bear stress test to me so far.
Subscribe to All American Investor via Email

Bob DeMarco is a citizen journalist and twenty year Wall Street veteran. Bob has written more than 500 articles with more than 11,000 links to his work on the Internet. Content from All American Investor has been syndicated on Reuters, the Wall Street Journal, Fox News, Pluck, Blog Critics, and a growing list of newspaper websites. Bob is actively seeking syndication and writing assignments.


More from All American Investor


Tuesday, March 10, 2009

S and P 500 Rally Comes as Predicted (Chart)


On Saturday I wrote, S and P Monthly Chart indicates a sharp rally is coming soon. Well it didn't take long. Here is the view of the chart I included.


It was clear that the down slope of the market was too severe and could not be maintained.

I'll be back tonight with some ideas on what I see coming. I will say, an inside day, followed by a "hook" up does look interesting. Is this another two day rally in the big bear market, or something the bulls can really sink their teeth into?
Subscribe to All American Investor via Email


Bob DeMarco is a citizen journalist, blogger, and Caregiver. Bob wrote more than 500 articles with more than 11,000 links to his work on the Internet. His content has been syndicated on Reuters, the Wall Street Journal, Fox News, Pluck, Blog Critics, and a growing list of newspaper websites. Bob is actively seeking syndication and writing assignments.


Thursday, July 10, 2008

Is the Hindenburg Omen forecasting a Stock Market Crash?


Stock traders are talking up the Hindenburg Omen. Is the Hindenburg Omen forecasting a stock market crash?

The Hindenburg Omen and the Criteria.

Or view a video over on the Two-Way Street Blog on CNBC

Criteria

The traditional definition of a Hindenburg Omen has five criteria:

* That the daily number of NYSE new 52 Week Highs and the daily number of new 52 Week Lows must both be greater than 2.2 percent of total NYSE issues traded that day.
* That the smaller of these numbers is greater than 75. (this is not a rule but a function of the 2.2% of the total issues)
* That the NYSE 10 Week moving average is rising.
* That the McClellan Oscillator is negative on that same day.
* That new 52 Week Highs cannot be more than twice the new 52 Week Lows (however it is fine for new 52 Week Lows to be more than double new 52 Week Highs). This condition is absolutely mandatory.

These measures are calculated each evening using Wall Street Journal figures for consistency. The occurrence of all five criteria on one day is often referred to as an unconfirmed Hindenburg Omen. A confirmed Hindenburg Omen occurs if a second (or more) Hindenburg Omen signals occur during a 36-day period from the first signal.