Showing posts with label supply. Show all posts

Saturday, July 18, 2009

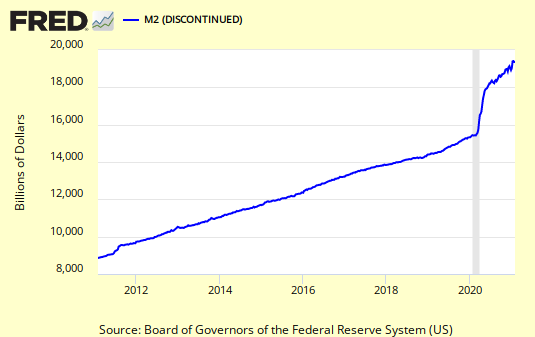
M2, Money Supply Showing Signs of a Peak (Graph)


Subscribe to EF Hutton via Email

M2


Bob DeMarco is a citizen journalist and twenty year Wall Street veteran. Bob has written more than 700 articles with more than 18,000 links to his work on the Internet. Content from All American Investor has been syndicated on Reuters, the Wall Street Journal, Fox News, Pluck, Blog Critics, and a growing list of newspaper websites. Bob is actively seeking syndication and writing assignments.


Kindle: Amazon's 6" Wireless Reading Device

Friday, June 19, 2009

Money Supply Climbs to New High (M2, Graph)


Subscribe to EF Hutton via Email

Bob DeMarco is a citizen journalist and twenty year Wall Street veteran. Bob has written more than 500 articles with more than 11,000 links to his work on the Internet. Content from All American Investor has been syndicated on Reuters, the Wall Street Journal, Fox News, Pluck, Blog Critics, and a growing list of newspaper websites. Bob is actively seeking syndication and writing assignments.


Follow E F Hutton on Twitter

Kindle: Amazon's 6" Wireless Reading Device

Sunday, May 24, 2009

Fed Series M2, Money Supply Still Soaring (Chart)


Fed Data, M2, Money Stock, Chart


We wrote several months ago about how it takes 12-18 months for increases in money supply to effect interest rates and commodity prices. We are now in this window.

The dramatic increases in money supply, the Fed balance sheet, and the drop in the dollar are starting to weigh on investor confidence.

Stocks rarely rise when confidence dwindles. It now seems we are moving from what was growing confidence in the markets to growing uncertainty.

The risk of owning equities on a short term basis not outweighs the reward. The threat of rising interest rates has also risen dramatically. This weeks surge in Gold is another barometer of investor confidence.
Subscribe to EF Hutton via Email

Bob DeMarco is a citizen journalist and twenty year Wall Street veteran. Bob has written more than 500 articles with more than 11,000 links to his work on the Internet. Content from E F Hutton has been syndicated on Reuters, the Wall Street Journal, Fox News, Pluck, Blog Critics, and a growing list of newspaper websites. Bob is actively seeking syndication and writing assignments.


Follow E F Hutton on Twitter

Kindle: Amazon's Wireless Reading Device (Latest Generation)

Tuesday, May 12, 2009

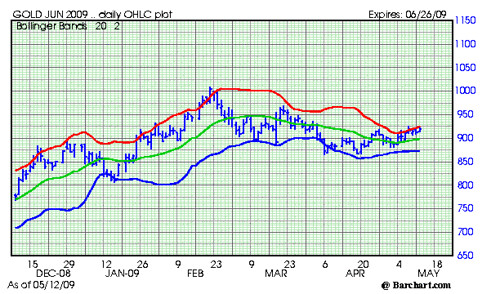
Is Gold Ready to Soar? (Outlook, Chart)


June Gold, Bar, Chart


Gold has a tendency to be seasonally week from March through August. As a result, it is always risky to speculate in gold during this time frame.

In April, we wrote that gold was likely to test the 865 - 875 area. This happened, the market held, and made a very nice double bottom. This is now an area of major support.

Right now gold is running into resistance in the 827 area.

Any close over 827.50 would indicate that gold is ready to move higher.
Subscribe to All American Investor via Email
The market place is now starting to focus on the potential inflationary impact of the policies being carried out by the Federal Reserve and Treasury. The money supply, Fed balance sheet, and reserve balances are all soaring. The Treasury is buying mortgage backed securities and treasuries in an attempt to keep interest rates artificially low.

This is a big positive for gold. The marketplace is beginning to sense that a major increase in inflation is on the horizon. Gold is likely to discount this phenomena well in advance.

Gold, like all commodities, goes up when demand increases and supplies get tight. Both are happening right now.

What to watch:
  • Purchases of gold by the SPDR Gold Shares -- GLD. The ETF is now the sixth largest holder of gold in the world. When demand for the shares increase their purchases of physical gold increase.
  • Demand out of China. This includes buys by the Central Bank and demand for jewelry. Sooner or later demand from China is going to be explosive. While it is not well known, during the last big bull market in gold, much of the upside was fueled by purchases out of Hong Kong.
  • Any close over 827.50 basis June Gold.

Background:
  • Gold has a tendency to be weak on a seasonal basis at this time of year. This pattern usually persists until summer.
  • Industrial and jewelry demand for gold has been slow due to the weakness in the global economy.
  • The market experienced some jitters on a rumor of IMF gold sales. This is not happening.
  • The market also sold off on news out of India that demand for gold was dropping.
  • Seasonal demand patterns in gold are sometimes offset by investor demand for physical gold and ETFs.
  • Central banks continue to be large net sellers of Gold. Central banks have been net sellers of gold sales since 1999. Obviously, investor demand has been offsetting these large sales.

Here is some history on gold since 1980.
  • Gold rallied from $135 an ounce in 1978 to $860 an ounce in 1980.
  • The late 70s-80s gold rush was caused by consumer fears about inflation. The monthly CPI reading reached 1.5 percent in 1980. Gold peaked along with the inflation rate.
  • From 1980 until late 1999 gold prices trended down.
  • Gold bottomed near $250 an ounce in 1999.
  • When gold was making its lows in 1999, most of the major Central Banks around the world announced they intended to sell-off a large fraction of their gold reserves (400 tonnes a year, 2000 tonnes total).
  • Central banks are still selling their gold reserves in 2009 (500 tonnes a year, 2500 tonnes total).
  • Central banks continue to sell gold and the price continues to rise.
  • Since the late 1980s the purchases of gold by institutional investors has been rising. This trend continues and seems to be picking up momentum.
  • Demand for gold rose sharply in the fourth quarter of 2008, up 27 percent to $26.7 billion (year over year, Q4-2007 versus Q4- 2008).


    Bob DeMarco is a citizen journalist and twenty year Wall Street veteran. Bob has written more than 500 articles with more than 11,000 links to his work on the Internet. Content from All American Investor has been syndicated on Reuters, the Wall Street Journal, Fox News, Pluck, Blog Critics, and a growing list of newspaper websites. Bob is actively seeking syndication and writing assignments.


    Follow All American Investor on Twitter

Tuesday, April 14, 2009

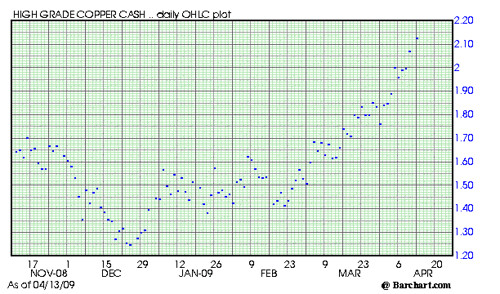
Copper Soaring, China Buying (Chart)


Cash Copper, Daily Price Mark

Cash Copper Chart 414

The chart contains a single price (dot) for each trading day.

Notes:
  • The price of copper is moving up fast. This is being caused by buying out of China.
  • China is a large importer of cooper. They import about 85 percent of their need.
  • On December 24, copper traded at the low price of 124.75.
  • Today the price was marked at 212.55.
  • The price of copper has risen 70 percent in the last 4 months.
You should be looking at Freeport McMoran (FCX). Freeport benefits from rises in the price of copper. The company is also a large producer of gold. We will cover Freeport McMoran tommorow.

You should note the effect that demand from China can have on commodity prices. One theme that should become evident is that when China starts to demand the supply of a commodity its price is likely to rise dramatically. This will create lots of opportunites for smart investors.

There are several ways to take advantage of thirsty demand for commodities from China. These include: sector stocks, ETFs, options, and commodity futures contracts.

We will be honing in on these opportunities in the days and weeks ahead.

So stay tuned daily.
Subscribe to EF Hutton via Email

Bob DeMarco is a citizen journalist and twenty year Wall Street veteran. Bob has written more than 500 articles with more than 11,000 links to his work on the Internet. Content from All American Investor has been syndicated on Reuters, the Wall Street Journal, Fox News, Pluck, Blog Critics, and a growing list of newspaper websites. Bob is actively seeking syndication and writing assignments.


Saturday, March 21, 2009

Money Supply continues to Soar (Chart)


Money Suppy320

M2, Money Stock continues to soar and accelerate. Chart current through March 20.
Subscribe to EF Hutton via Email