Showing posts with label market. Show all posts

Wednesday, July 22, 2009

Mortgage Applications and Interest Rates Increase


  • The average contract interest rate for 30-year fixed-rate mortgages increased to 5.31 percent from 5.05 percent, with points increasing to 1.18 from 1.12 (including the origination fee) for 80 percent loan-to-value (LTV) ratio loans.
  • The Market Composite Index, a measure of mortgage loan application volume, was 528.9, an increase of 2.8 percent on a seasonally adjusted basis from 514.4 one week earlier.
  • The Refinance Index increased 4.0 percent to 2089.7 from 2009.4 the previous week.
Source: Mortgage Bankers Association
Subscribe to EF Hutton via Email
Kindle: Amazon's 6" Wireless Reading Device

Thursday, June 18, 2009

Mortgage Refinance and Loan Market Deteriorates


Are higher interesting rates effecting refinancing? Is the Housing Market picking up?

Refinancing
  • The Refinance Index dropped 23.3 percent to 1998.1 from 2605.7.
  • The four week moving average for the seasonally adjusted Refinance Index is down 19.6 percent.
  • The refinance share of mortgage activity decreased to 54.1 percent of total applications from 59.4 percent the previous week.
Mortgage Loans
  • The Market Composite Index, a measure of mortgage loan application volume, was 514.4, a decrease of 15.8 percent on a seasonally adjusted basis from 611.0 one week earlier.
  • The four week moving average for the seasonally adjusted Market Index is down 13.5 percent. The Purchase Index decreased 3.5 percent to 261.2 from 270.7 one week earlier.
***Mortgage Bankers Association (MBA)Weekly Mortgage Applications Survey for the week ending June 12, 2009.
Subscribe to EF Hutton via Email


Kindle: Amazon's 6" Wireless Reading Device

Monday, May 18, 2009

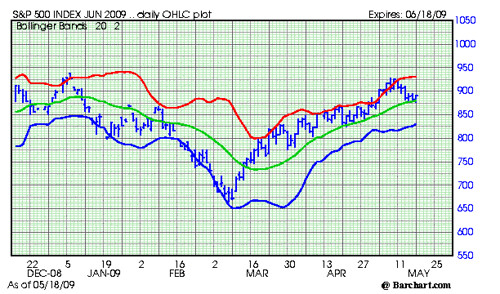
S and P Under Pressure, Holding the Green Line (Chart)


June S and P Future, Bar, Chart

June S and P Chart 518


The S and P is banging off the green line, the first area of major support. Overnight, the market hit 875.40 which is the top of a major swing point in the market (865 - 875).

The market remains vulnerable, but the hold at this level brings into question which way next.

On the way back up, 895-900 is the critical level. On the way down, 865 is critical.

Short term it appears that the market will remain under pressure for the next two weeks.

Technical resilance is dwindling and this could be signaling a change in trend to the downside.

The risk reward ratio is not currently favoring short term long positions
Subscribe to EF Hutton via Email

Thursday, May 07, 2009

They called me crazy, S and P 900-1000 (Part Two)


When I wrote Stocks Don't Fight the Tape the S and P 500 was around 768. I predicted a rally into the 900-1000 area.

I followed that up with They called me crazy, S and P 900-1000

What next?

S and P 500 Chart 507
  • The stock market is currently overbought.
  • The technical correction in the current bear market is two months old.
  • A major retracement to the downside is likely, and is imminent.
  • We could see additional upside to the 940 area versus the S and P 500.
  • A test of the 840 area is likely.
  • Once the correction gets underway we should get a better understanding of the structure of the market. Begining of long term bull, or bear market still in tact?
  • The important 200 day average is still about 100 points above the market and the down ward slope of that average is becoming more severe. This is not a good sign.
The bottom line. The risks out weigh the rewards at this level.

This has been a tremendous rally that I expected. However, in terms of price and duration it fits the requirements for a correction in a market that is still trending down.

In addition, the longer dated treasury interest rates are turning up. This is a negative. The dollar looks very vulnerable right now. Another negative. The combination of rising rates in the long end and a dropping dollar does not bode well for stocks.
Subscribe to All American Investor via Email
Bob DeMarco is a citizen journalist and twenty year Wall Street veteran. Bob has written more than 500 articles with more than 11,000 links to his work on the Internet. Content from All American Investor has been syndicated on Reuters, the Wall Street Journal, Fox News, Pluck, Blog Critics, and a growing list of newspaper websites. Bob is actively seeking syndication and writing assignments.


Follow All American Investor on Twitter

Wednesday, April 01, 2009

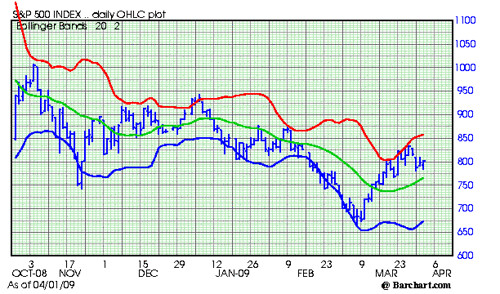
S & P 500 Stress Test for the Bears


S and P 500, Chart, Daily, Midday.

S & P 500 Stress Test

Highlights:
  • It is early in the day but the market made a new low, below yesterday's low, reversed, and is now clawing its way back over 800. A positive short term development.
  • The chart gap is still in play. The S & P needs to trade to 813.43 to fill the gap. This area should be watched closely.
  • Trading is slow so far. However, it the market closes above that gap the bears will be forced to run for cover.
  • A close above yesterday's high of 810.48 would give us an outside up day. That would be very bullish. It would also give us another hook up in the chart.
  • We need to watch closely to be sure support is building below the market. A pattern of higher highs and higher lows is what we are looking for to remain bullish.
In spite of all the bear chatter and shorting in the market, the S and P is only 30 points from the high for this move--made last week. A move above yesterday's high will put extreme pressure on the bears.

Looks like a bear stress test to me so far.
Subscribe to All American Investor via Email

Bob DeMarco is a citizen journalist and twenty year Wall Street veteran. Bob has written more than 500 articles with more than 11,000 links to his work on the Internet. Content from All American Investor has been syndicated on Reuters, the Wall Street Journal, Fox News, Pluck, Blog Critics, and a growing list of newspaper websites. Bob is actively seeking syndication and writing assignments.


More from All American Investor


Sunday, March 29, 2009

Amazon . Toast (AMZN) up 5000 percent since IPO (Chart)


From All American Investor

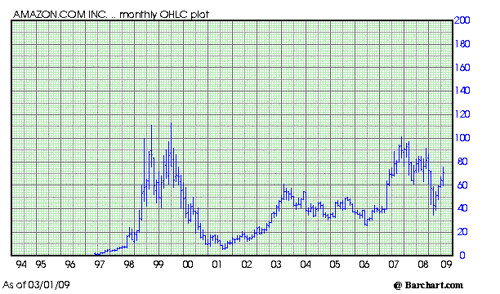
Amazon (AMZN), Ten Year Chart, Monthly.

In May, 1997 Amazon (AMZN) was labeled Amazon.toast and Amazon.bomb by Forrester Research and Barron's. Since then it has risen more than 5,000 percent.

Amazon Chart Ten Year 328Align Center

Highlights:
  • Amazon was founded in 1994, and went public in 1997.
  • In 1997, Amazon was labeled Amazon.toast and Amazon.bomb by Forrester Research and Barron's.
  • By 1999, cumulative losses at Amazon exceeded $550 million.
  • In December, 1999, Jeff Bezos was chosen as Time magazine's person of the year (see Cover).
  • In December 1999, Amazon reached its highest raw price in history at $113 a share.
  • In the summer of 2000, an analyst at Lehman Brothers warned investors that the company might run out of cash and advised them to avoid its stock.
  • In September 2001, Amazon dropped to its lowest raw price in history--$5.67 a share.
  • In October, 2007 Amazon traded over $100 a share for the third time, and the first time since 1999.
  • The split adjusted price of Amazon dating back to 1997 is $1.31 a share.
  • On March 23, 2009 Amazon closed at $75.61 a share, its highest price since falling to $34.68 a share in November, 2008.
  • Amazon is currently up more than 50 times its adjusted initial public offering price, or 5,700 percent.

A month after Jeff Bezos' was named Time's person of the year, the company fired 150 workers as part of an internal reorganization. Just five days later, Amazon reported a loss of $323 million for the holiday fourth quarter and promised that future losses would be lower. (The company, however, would later exceed that amount by more than $200 million).

Follow All American Investor on Twitter
Subscribe to All American Investor via Email

Sunday, March 22, 2009

S and P 500 Weekly Chart


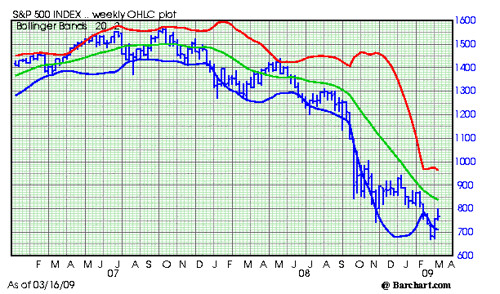
S an P 500 Weekly Chart March


On March 7, we posted the Monthly chart of the S and P 500 and pointed out the slope of the market was unsustainable and that a rally was likely. From that article,
You can see the slope of the market is very severe. This cannot be sustained much longer. When a market index trades down at a sharp angle like the one above (See March 7 chart), the market always rallies sharply when it reverses directions. This rally could start at any time.
Since then, we had two weeks up in the market as shown in the weekly chart above.

Now the question is what next? Technically this is a difficult question to answer. I would say this week is fifty-fifty. As you can see, the downtrend is still intact. The market is now above the blue line which indicates the severe oversold condition is not over. Overall, it is always more risky to be a buyer when the trend of the market is down--so it is still a time to be very cautious. I would also so, at this point the easy money has already been made on the downside. Toss up.

My best guess right now is that market is going to continue to consolidate and move sideways in the area between 663 and 800 before it makes its next move. On the fundamental side, I will be posting a new article entitled, Don't Fight the Tape, which makes an argument for additional upside in the market.
Subscribe to EF Hutton via Email
Bob DeMarco is a citizen journalist and twenty year Wall Street veteran. Bob has written more than 500 articles with more than 11,000 links to his work on the Internet. Content from All American Investor has been syndicated on Reuters, the Wall Street Journal, Fox News, Pluck, Blog Critics, and a growing list of newspaper websites. Bob is actively seeking syndication and writing assignments.

Tuesday, March 10, 2009

Doctor Doom Nouriel Roubini: Stock Market to Go Much Lower


This is directly from an email I received from the RGE Monitor.

Roubini of RGE Monitor: Stock Market to Go Much Lower

Can we rule out another bear market rally some time in 2009?
No, we cannot rule out another bear market sucker’s rally in 2009, most likely in Q2 or Q3. The drivers of this rally will be the improvement in second derivatives of economic growth and activity in U.S. and China that the policy stimulus will provide on a temporary basis. Given the severity of macro, household, financial firms and corporate imbalances in the U.S. and around the world this Q2 or Q3 sucker’s market rally will fizzle out later in the year like the previous 5 ones in the last 12 months.
Subscribe to EF Hutton via Email

What are the downside risks to these bearish predictions for U.S. and global equities?
On the downside there is at least a third probability of an L-shaped global near depression rather than the mere current severe U-shaped recession. If a near depression were to take hold globally a 40% to 50% further fall in U.S. and global equities from current levels could not be ruled out. But in this L-shaped near depression the last thing one would have to worry about would be stock markets as more severe issues would have to be addressed.
What are the upside risks to these bearish predictions for U.S. and global equities?
On the upside, we have an aggressive policy stimulus in the U.S. and other countries that might lead to a faster sustained economic and financial markets recovery that expected here. The bullish argument for a non-bear market and early persistent recovery of global equities is based on a better than expected recovery of the U.S. and global economy.
Bottom Line: P/E and S&P Index
Earnings per share (EPS) of S&P 500 firms will be in the $ 50 to 60 range, but they could fall to $40. The price earnings (P/E) ratio may fall in the 10 to 12 range in a U-shaped recession. If earnings are closer to 50 or the P/E ratio falls to 10 then the S&P could fall to 600 (12 x 50 or 10 x 60) or even to 500 (10 x 50). Equivalently the Dow (DJIA) would be at least as low as 7000 and possibly as low as 6000 or 5000.


Nouriel expounded the above topics further at the CBOE 25th Annual Risk Management Conference at Laguna Beach where he was the keynote speaker.

Read more of Nouriel’s and other RGE Monitor analysts’ views on the current economic and financial situation on www.rgemonitor.com or contact sales at info@rgemonitor.com.

Bob DeMarco is a citizen journalist, blogger, and Caregiver. Bob has written more than 500 articles with more than 11,000 links to his work on the Internet. The content has been syndicated on Reuters, the Wall Street Journal, Fox News, Pluck, Blog Critics, and a growing list of newspaper websites. Bob is actively seeking syndication and writing assignments.


Friday, March 06, 2009

Are Mutual Funds Getting Ready to Capitulate?


Rumors are starting that a couple of mutual funds are in trouble. I can't confirm or deny at the moment.

Earlier this week I wrote about the increase in investors calls to both Vanguard and T. Rowe Price. See Investors pull $33 Billion out of Market.

When investors get scared, and they can't take it anymore, they often dump all their stocks. A form of the madness of the crowd--they sometimes do this in unison. Imagine 100,000s of investors all pushing the panice button at the same time. There are somewhere in the neighborhood of 88 million investors in the United States.
Could we be on the verge of a market capitulation?

See: Market Capitulation Means Big Opportunity to Make Money and S an P Support 659 and dropping, Market Capitulation?
Subscribe to EF Hutton via Email


Bob DeMarco is a citizen journalist, blogger, and Caregiver. In addition to being an experienced writer he taught at the University of Georgia , was an Asociate Director and Limited Partner at Bear Stearns, was CEO of IP Group, and is a mentor. Bob currently resides in Delray Beach, FL where he cares for his mother, Dorothy, who suffers from Alzheimer's disease. Bob has written more than 500 articles with more than 11,000 links to his work on the Internet. His content has been syndicated on Reuters, the Wall Street Journal, Fox News, Pluck, BlogCritics, and a growing list of newspaper websites (15). Bob is actively seeking syndication and writing assignments.


S an P Support 659 and dropping, Market Capitulation?


Could we be on the edge of a market capitulation?

The S and P 500 continues to trend down with support for today in the 659 area. 659 is about 3.7 percent lower than the current S and P price as I am writing this.

A market capitulation occurs when investors surrender all hope of recouping their losses in the market--and sell in a panic.

It appears to me that we could be reaching the capitulation point. The market bears close watching today. A close around or below the 659 area would not bode well for the opening on Monday morning. On the other hand, a market capitulation is one of the few times where you can make real money in the market quickly.
clipped from charts.barchart.com
Chart for S&P 500
blog it

Thursday, March 05, 2009

Market Capitulation Means Opportunity to Take Real Money Out of the Market


A market capitulation occurs when investors surrender all hope of recouping their losses in the market. For me, a capitulation means when investors "puke", or cry uncle. We could be on the edge of a market capitulation right now. It could happen as early as tomorrow morning or Monday morning.


In order to win big at the point of a market capitulation you have to be ready to roll before it happens. You might be expecting a capitulation several times before it actually happens. But, when it does, you can take real money out of the market.
Subscribe to EF Hutton via Email

Here is how you take advantage of a market capitulation. First, you identify a small number of great companies whose stocks have been getting hammered because the market is going down, not because they are doing poorly. You have your orders placed in the market well before the market opens in the morning. You place those orders on the stocks you want to buy 8-10 percent below the previous day's close. You are ready to roll.

When a market capitulation occurs, a virtual tsunami of orders all come in on one side--sell orders. When the orders start piling up, funds manager realize they are going to need to raise cash. So they take the easiest, most efficient path to accomplishing that mission--they hit the bid on the best capitalized companies with the biggest bid regardless of the long term outlook on the company. They need cash and that is the name of the game.

When the herd sees their stock getting slammed they are not thinking about the above, they are thinking about survival. They fire in their panic stricken sell orders. The short term investors who have been trying to pick the bottom for a long time can no longer stand the heat. They sell and add fuel to the fire (well, fire sale).

You now have perfect storm--nothing but sellers. Sellers willing to part with stocks at any price--no matter how low. And, you are willing to buy at those amazingly low prices.

Do you know how many stocks traded at prices never to be seen again on October 19, 1987? Imagine buying Intel (INTC) at 88 cents a share, or Microsoft (MSFT) at 31 cents a share (adjusted historical prices, Google Finance).

That is what opportunity looks like when it knocks.

You will be well advised to be placing orders in the market before you go to bed. Remember, 8-10 percent below the last price.

Market capitulations are impossible to predict. But, we may get one here.

Ask yourself this question--are investors reaching the point where they can't take it anymore? Are 100,000s of investors all around the world getting ready to throw in the towel? The phenomena that is getting ready to occur is known as the--madness of the crowd. This could be it.

Please note: I am the same guy that said, Cash is King, back in September. I wrote-- Financial Meltdown--Where there is Smoke, there is Fire--an article that predicted AIG and the coming financial debacle. The S and P 500 was well above 1200 when I wrote that article. You could have read it right here at All American Investor.
Bob DeMarco is a citizen journalist, blogger, and Caregiver. In addition to being an experienced writer he taught at the University of Georgia , was an Associate Director and Limited Partner at Bear Stearns, was CEO of IP Group, and is a mentor. Bob currently resides in Delray Beach, FL where he cares for his mother, Dorothy, who suffers from Alzheimer's disease. Bob has written more than 500 articles with more than 11,000 links to his work on the Internet. His content has been syndicated on Reuters, the Wall Street Journal, Fox News, Pluck, Blog Critics, and a growing list of newspaper websites. Bob is actively seeking syndication and writing assignments.


More from All American Investor


Wednesday, February 25, 2009

Test of Banks Could lead to a Bottom in the Stock Market


This is one of the better articles I have read on the stress test--Stress Test for Banks Exposes Rift on Wall St. It has me thinking about the long term direction of the stock market.

I think if you read this article carefully you might conclude that much of what is being written about banks is getting discounted in the stock market. I am not saying everything is beautiful. Quite the contrary, we are teetering on the brink of disaster. But, I find myself asking myself constantly--has the market discounted the news. It is always hard when things look bleak to see the light at the end of the tunnel. However, the market always discounts the future long before the future gets here. The market always bottoms when things look bleakest to the herd. The herd tends to focus on the recent past, rarely looking forward into the future.

I am reminding myself that back in 1990-91 Ross Perot was shorting Citibank stock. If you had bought the stock back then you could have made more than 30 times your money by 2006.

At the time of the 1991 recession there were many that felt the banks were going to go broke. Remember, we were just coming through the S and L Crisis and the failure of some major banks in the southwest. The stock market had crashed in 1987 and we were entering a recession. The time really looked bleak. Most investors had thrown in the towel and were focusing on the past.

If you are old enough, you might remember that from 1966 to 1982 the market traded in a broad trading range that was capped by Dow 1060. Up and down, up and down, The Dow did crash down to the 550 area in 1973, and the 750 area in 1980.

Most of you are too young to remember that the S an P 500 traded around 102 in 1973 and again in 1982 (you read that right 102). It turned out that August, 1982 was the bottom of a long term consolidation and the beginning of the bull market. The Dow crashed through the ceiling and the market soared.

I am starting to believe we are nearing a major low in the market. So put me down the way I have been for some time--long term bullish, short term bearish. Not quite ready to the jump all the way into the pool. It is a good time to stick your foot in the water and check the temperature.

These hot flash day rallies in this stock market downturn are not making me feel like I am missing out on anything. I do find it amusing that every time we have a nice up day the talking heads on television get all excited and start talking bull market.

The market rarely goes up or down in a straight line. The rallies right now are for suckers who think every tiny piece of news is what is going to make the market go up or down long term. Each piece of news is like a piece of the puzzle. It is not the puzzle.

These hot interpretations of every little blip on the news screen makes the market go up and down like a yo-yo. But, it is the long term trend of the market that is most important; and, the big picture fundamentals set the stage for the big big moves. You make the big bucks by spotting the long term trends and being patient once they get underway.

I'll leave with two things. First, read the article about stress testing banks--to me this is a good thing and might be an event that could put in the bottom for the stock market. I am thinking we could be in for a 20-30 percent rally soon. Second, the major trend of the stock market is still down--so it is very risky to have the boat loaded. Foot in the water--good, water up to your neck--not good. Chicken on hill, maybe.
Subscribe to EF Hutton via Email


Stress Test for Banks Exposes Rift on Wall St

The New York Times
By ERIC DASH

Big banks keep insisting that they have all the capital they need — a claim that might strike many people as absurd at a time the government is spending billions of taxpayer dollars to prop up the financial industry.

So here is a surprise: By some common measures, the banks do have enough capital.

The problem is, it is not the kind of capital investors think the banks need.

For years, the question of what constitutes a bank’s capital, and how to measure it, was largely academic. But the issue is coming to the fore as federal regulators start administering a tough new “stress test” to 20 large banks on Wednesday to determine how the banks would withstand a severe economic downturn.

Investors in the stock market and the banks are increasingly at odds over how to assess the health of financial institutions. Where regulators side could determine the fate of many lenders, particularly big banks like Citigroup and Bank of America, whose share prices have plummeted this year on fears the government will increase its ownership of them.

Until the financial system deteriorated last fall, investors focused on what is known as Tier 1 capital, which consists of common stock, preferred stock and hybrid debt-equity instruments.

Now, however, they are focusing on what is called tangible equity capital, which includes only common stock, saying it is a better way to measure the risk in bank shares.

The difference might sound like something only an accountant would worry about, but it lies at the heart of two questions confounding both Washington and Wall Street: Are the nation’s banks sound? And are bank shares a good barometer for the health of the financial system?

Sheila C. Bair, the head of the Federal Insurance Deposit Corporation, said on Tuesday that the nation’s banking industry was safe. “All these large banks exceed regulatory standards for being well capitalized, so for right now, they’re fine,” Ms. Bair said on CBS television’s “The Early Show.”

“I think the big issue is how much of an additional buffer they have to withstand more adverse economic situations and that’s something we’re going to try to figure out with a stress test.”

But Citigroup, which maintains that it is well capitalized by its regulators’ standards, was nonetheless locked in negotiations with the government on Tuesday over a third rescue. Under the plan, the government is expected to raise its stake in Citigroup to 30 to 40 percent, from about 8 percent now. The deal, which was moving toward completion and could be announced as early as Wednesday, would bolster the level of common stock that investors are focused on.

At Bank of America, Kenneth D. Lewis, the chief executive, assured the bank’s employees on Monday that Bank of America has enough capital, including common stock. “I have said repeatedly that our company does not need further assistance today and I don’t believe we’ll need any more in the future,” Mr. Lewis wrote in a memorandum.

Like regulators, investors are struggling to determine how much additional capital banks might require if the recession deepens and unemployment rises, developments that would almost certainly lead to new, heavy losses at banks.

Institutions that fail the stress test will be required to raise new capital, probably through more money from the government.

Beaten-down financial shares rallied on Tuesday after Ben S. Bernanke, the chairman of the Federal Reserve, seemed to rebuff suggestions that banks might be nationalized outright. Even so, Mr. Bernanke offered a sober assessment of the economy to Congress on Tuesday.

Details of the bank stress test are scant, but federal regulators are expected to examine the ability of banks to cope with a situation in which unemployment rose to 10 to 12 percent and home prices declined by an additional 20 percent, according to Treasury Department and Federal Reserve officials. While officials say they don’t expect such a severe downturn, some economists aren’t ruling one out.

In recent weeks, federal regulators were planning to continue to demand that banks maintain Tier 1 capital equivalent of at least 6 percent of total assets adjusted for risk. Regulators also want at least half of it in common stock, but have given banks some leeway.

On Monday, the federal banking regulators issued a statement saying that if the stress test indicated an “additional capital buffer” was necessary for some institutions, it “did not imply a new capital standard and is not expected to be maintained.”

But stock investors are homing in on tangible common equity. Whereas Tier 1 capital gives regulators comfort because it captures a bank’s ability to weather a financial storm, stock investors, who suffer the first losses, are worried about their own exposure. Tangible common equity, or T.C.E., they argue, is the best measure for them.

Until last fall, there was little difference between the two measures. But when the government made big investments of preferred stock to shore up banks, common shareholders became more vulnerable.

John McDonald, an analyst at Sanford C. Bernstein & Company, compared the move to an army reinforcing its troops from the back. “Any reinforcements improve the chances of winning the battle,” he said. But if you are a stockholder, “you are still the guy taking the first hit on the front line.”

Regulators worry that banks’ depositors and trading partners might interpret more bad news for banks — including a continued decline in share prices — as a sign confidence is flagging. As a result, regulators, too, are focusing more on tangible equity.

“If our banking system looks frail and hobbled, we care since there could be a loss of confidence” Mr. McDonald said. “But the stock price may very well not be a reflection of the broader risk.”

Louise Story contributed reporting.

More from All American Investor



Monday, February 23, 2009

Stocks: Down side range expansion continues--good trade opportunity


The downside range expansion continues and all systems indicate that market is going lower. You will notice the spike down to the 741 area in November. Will history repeat itself? I think to some extent it will. Traders should be on their toes for any spike below 741 overnight or early Tuesday morning.

I doubt we will see the monster rally we saw in November. But, looks good for a nice fat trade.

Complacent longs are still in the market and so far they have not capitulated. Sometime soon, very soon they are going to cry "Uncle".
clipped from charts.barchart.com

Chart for S&P 500

blog it


Subscribe to EF Hutton via Email
Any price action below 741 on Tuesday should show excellent resilience. The market should hold downside thrusts very well below 737.

Under 740 tomorrow favors quick, long side trades. If the market can muster a two day rally, it should be ready to start down with a vengeance. The market rarely closed lower 7 days in a row. These are rare times, however


More from All American Investor


Bailout Nation: U.S. May Draw Citi Into Tighter Embrace


Bank nationalization is hanging over the market. But as far as taxpayers go the last thing we want is common stock. The reverse should be happening: common stock holders and existing debt holders should be getting crammed down in any reorganization that includes bailout funds, that is, taxpayer dollars.
Fears that Citigroup would succumb to the fate of American International Group and be outright nationalized sent its stock into a tailspin last week, ending Friday at a paltry $1.95. That gives Citi a market capitalization of just over $10 billion. One year ago, it had a market value of over $137 billion, and even that was considerably less than in Citi's glory days.

Though the deal believed to be under discussion would incur no additional costs to taxpayers, it would hammer common stockholders. News reports Sunday evening had the bank, either voluntarily or at the behest of the government, converting preferred shares held by the government into common shares, which would dilute existing stockholders. The government could end up holding 40% of the company's equity.

Subscribe to EF Hutton via Email

U.S. May Draw Citi Into Tighter Embrace

For the third time in four months, Citigroup is looking for government help to shore up its capital.

The question is whether more government involvement above and beyond the $45 billion the bank has already taken in two installments in October and November, not to mention the guarantee against losses on $300 billion of assets, would do anything to restore confidence.

Fears that Citigroup would succumb to the fate of American International Group and be outright nationalized sent its stock into a tailspin last week, ending Friday at a paltry $1.95. That gives Citi a market capitalization of just over $10 billion. One year ago, it had a market value of over $137 billion, and even that was considerably less than in Citi's glory days.

Though the deal believed to be under discussion would incur no additional costs to taxpayers, it would hammer common stockholders. News reports Sunday evening had the bank, either voluntarily or at the behest of the government, converting preferred shares held by the government into common shares, which would dilute existing stockholders. The government could end up holding 40% of the company's equity.

Citigroup wouldn't comment on the reports, except to reiterate a statement it made last week when the nationalization rumors were making the rounds. "Citi's capital base is very strong and our Tier 1 capital ratio as measured at the end of the fourth quarter was 11.9%, among the highest in the industry. We continue to focus and make progress on reducing the assets on our balance sheet, reducing expenses and streamlining our business for future profitable growth," a spokesman said.

Citi, reeling from $18 billion in losses for 2008 and massive exposure to the consumer loan market, is already in the process of splitting itself in two. It's taking more than $800 billion of unwanted assets and businesses, like mortgage lending and consumer finance, and segregating them in a new business unit with its own management, who will spend their time selling the assets or otherwise disposing of them.

It also sold a majority of its crown jewel, Smith Barney, to a joint venture with Morgan Stanley.

The rest of Citi, which is returning to its pre-1998 name Citicorp, will continue on and presumably perform better without those money-losing assets and noncritical businesses. The remaining businesses will include corporate and retail banking, private banking and wholesale services around the world.

Announcing the plan in January, CEO Vikram Pandit explained, "This new structure will provide a wide range of options going forward to continue strengthening our core franchise."

But Citi faces a stress test by the government, and the results might not be pretty. Like many other banks, Citi faces mounting consumer loan losses, which are only being exacerbated by rising unemployment.

The stress testing, which is mandatory for the 15 biggest U.S. banks with more than $100 billion of assets, begins in the coming weeks. The Treasury Department, which is running the program, wants to find out whether the banks would have the capital they needed to continue to lend and absorb more losses if the economy were to weaken more than expected. Some think this stress testing, which is part of the Treasury's new Financial Stability Plan, means the government is imposing stricter capital standards on banks.

The fear is that any testing scenario will create a situation where there are clear winners (banks that don't have to take additional capital from the government but will likely be forced to anyway in a "voluntary" program to give the plan legitimacy), and clear losers (banks that will get capital injections that come with all sorts of additional restrictions on executive compensation, among other things).

Banks that go through a stress test will get access to a Treasury-provided "capital buffer" (an additional preferred equity stake) to bridge the time until the bank can raise the capital on the private markets. Given the restrictions that will likely accompany additional government injections, most see banks favoring raising capital in the private markets, if at all possible.

Citi has a number of wealthy constituents backing it, including Saudi Arabia's Prince Alwaleed bin Talal, whose fund has taken a major hit in the last few months. Other investors include the Abu Dhabi Investment Authority, the Government of Singapore Investment Corporation and the Kuwait Investment Authority. Some executives at Citi get stock awards that vest if the stock improves by a multiple of three in the next four years. Pandit, along with some other senior executives, didn't participate in the awards.

More from All American Investor


Follow EF Hutton on Twitter

Thursday, January 15, 2009

The Latest Bear Market Sucker’s Rally is Losing Its Steam as an Onslaught of Awful Macro and Earnings News Takes Its Toll


The information on this website is fantastic. Nouriel Roubini has been right on about the markets.
You will have to go through the registration process to get this story. It is free. They also have an excellent premium service.

I have been predicting for a while that the most recent bear market sucker’s rally would lose its steam and – like the previous bear market rallies in the last 18 months – US and global equities prices would head again towards new lows.

Let me now explain why…this will be the worst US recession in the last 50 years and the worst synchronized global recession in decades.

Tuesday, December 30, 2008

Nikkei Up on Last Session of 2008, Logs Worst Year Ever


Japan's Nikkei 225 Average fell 42 percent in 2008, the worst loss in its 58-year history, though the benchmark gained 1.3 percent on its final half-day of trade.

Its annual losses were the worst ever, surpassing the 38.7 percent tumble marked in 1990.
Subscribe to EF Hutton via Email

Follow EF Hutton on Twitter


Nikkei Up on Last Session of 2008, Logs Worst Year Ever

Japan's Nikkei 225 Average fell 42 percent in 2008, the worst loss in its 58-year history, though the benchmark gained 1.3 percent on its final half-day of trade.

Canon and other exporters gained as the dollar rose slightly against the yen before falling back, while oil and gas field developer Inpex climbed as oil extended gains on concern that Israeli attacks on Gaza could disrupt Middle East crude oil supplies.

Toyota Motor bucked the trend by slipping 1 percent, badly hit like the rest of the auto sector -- one of the Tokyo market's worst performing sectors this year -- by the worsening global economy. The Nikkei gained 112.39 points on Tuesday and rose 4
percent for December, its first positive month since May. But its annual losses were the worst ever, surpassing the 38.7 percent tumble marked in 1990.

The broader Topix index gained 0.5 percent on Tuesday to 859.24 but was also down 42 percent for the year. Trade will resume on Jan 5.

Market players forecast a tough 2009 but said that hopes of further economic stimulus packages to stem the worsening of the global economy were providing some lift.

"Everyone's pinning their hopes on economic stimulus policies by the United States and possibly China, which is keeping the market supported for now," said Tomomi Yamashita, a fund manager at Shinkin Asset Management.

"But people aren't watching things like company results as closely as they should be. We can't say for sure that the market's bottomed out until we see these next spring."

In one possible sign of things to come, shares of Sharp edged down 0.3 percent to 636 yen after the Nikkei business daily said the consumer electronics maker will book an extraordinary loss of more than 50 billion yen ($555 million) for the year to March 31, largely due to an impairment loss on its stake in Pioneer.

But other market players said the worst was likely over.

"The main problems in the United States are being tackled one by one, meaning a lot of uncertainties are being removed," said Hideyuki Ishiguro, a supervisor in the investment strategy division at Okasan Securities.

"The market has also factored in the various company losses this quarter and the gloomy predictions for next quarter, so these alone are unlikely to send it to new lows."

The U.S. government said on Monday it was pumping $5 billion into auto and mortgage lender GMAC LLC and lending up to $1 billion to automaker General Motors, ensuring the solvency of a company considered crucial to GM's survival and providing some marginal support to Tokyo shares.

Resources Shares Climb, Exporters Up

Oil prices rose after surging more than $2 on Monday amid concern that Israeli attacks on Gaza, which continued on Tuesday as Israeli aircraft fired missiles at government buildings in the Gaza Strip, could disrupt Middle East crude oil supplies.

More From CNBC.com
# Get After-the-Bell Dow 30 Quotes
# Credit Spreads and Libor Data
# Futures and Pre-Market Data
# Currency Data

Resource-linked shares such as Mitsubishi Corp and other trading houses climbed as a result.

Mitsubishi Corp, Japan's largest trading house, rose 2.8 percent to 1,238 yen and fellow trader Mitsui & Co gained 3 percent to 901 yen. Itochu Corp gained 1.8 percent to 443 yen. Oil and gas field developer Inpex surged 5.1 percent to 698,000 yen.

Blue-chip exporters rose as well, with Sony gaining 1.2 percent to 1,922 yen and Canon rising 2.8 percent to 2,770 yen.

But Toyota slipped 1 percent to 2,905 yen, though fellow automakers Honda Motor and Nissan Motor both rose.

Trade picked up on the Tokyo exchange's first section, with 854 million shares changing hands, compared with last week's morning average of 597 million. Advancing stocks outpaced declining ones by nearly 3 to 1.
Copyright 2008 Reuters. Click for restrictions.

URL: http://www.cnbc.com/id/28429197/

Tuesday, December 02, 2008

A Brief History of Stock Market Drops--the Last 80 years


Market Mayhem

There have been plenty of big selloffs in the stock market over the last month, but early on Friday Oct. 24, many market watchers thought it would bring the big one that would join other infamous days. For history's sake, however, the days since Lehman Brothers' chapter 11 have been momentous and notable enough. Here's a look at some very bad days and periods for stocks that got investors' attention over the past 80 years.

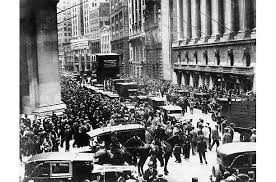
Crash of 1929
The stock market crash of 1929 saw the market fall 12.8 percent on Oct. 28, 1929, known as “Black Monday," but the market fell almost as sharply the day after. The crash contributed to the Great Depression of the 1930s and many also consider it part of a two-decade bear market.

1973-1974
During this period of the Nixon-Ford presidency, when inflation was a major concern because of the first oil spike, the Dow went from its Jan. 11, 1973 high of 1051.70 to a low of 577.60 on Dec. 6 1974, a 45.1 percent decline.

Oct. 19, 1987
Known as Black Monday, or "The Crash," the Dow fell 507.99 points, or 22.61 percent, as part of a broad global selloff.

Oct. 13, 1989
The failure of a leveraged buyout of airline holding company UAL triggered what was then known as the "Mini Crash." The Dow fell 190.58 points, a 6.91 percent decline.

1997
The financial crisis in Asia, primarily in South Korea, Indonesia and Thailand, had its largest impact on the US markets on Oct. 27, 1997 when the Dow dropped 554.26 points, 7.18 percent, forcing an early closing of the NYSE.

Dot-Com Bubble Burst
The tech sector was hit hard as the dot-com bubble burst. The Nasdaq peaked at 5048.62 on Mar. 10, 2000 before beginning a brutal two-month slide. By May 23, 2000, it was down 37.32 percent.

Sept. 17, 2001
The Dow dropped 684.81 points (7.12 percent) on Sept. 17, 2001, the Monday the New York Stock Exchange resumed trading for the first time after the 9/11 attacks.

Subscribe to EF Hutton via Email

Follow EF Hutton on Twitter

Thursday, July 10, 2008

Is the Hindenburg Omen forecasting a Stock Market Crash?


Stock traders are talking up the Hindenburg Omen. Is the Hindenburg Omen forecasting a stock market crash?

The Hindenburg Omen and the Criteria.

Or view a video over on the Two-Way Street Blog on CNBC

Criteria

The traditional definition of a Hindenburg Omen has five criteria:

* That the daily number of NYSE new 52 Week Highs and the daily number of new 52 Week Lows must both be greater than 2.2 percent of total NYSE issues traded that day.
* That the smaller of these numbers is greater than 75. (this is not a rule but a function of the 2.2% of the total issues)
* That the NYSE 10 Week moving average is rising.
* That the McClellan Oscillator is negative on that same day.
* That new 52 Week Highs cannot be more than twice the new 52 Week Lows (however it is fine for new 52 Week Lows to be more than double new 52 Week Highs). This condition is absolutely mandatory.

These measures are calculated each evening using Wall Street Journal figures for consistency. The occurrence of all five criteria on one day is often referred to as an unconfirmed Hindenburg Omen. A confirmed Hindenburg Omen occurs if a second (or more) Hindenburg Omen signals occur during a 36-day period from the first signal.