Showing posts with label PRICES. Show all posts

Tuesday, May 26, 2009

U.S.Home Prices Return to 2002 Level (Chart)


Home prices continued on their record decline.

The S&P/Case-Shiller U.S. National Home Price Index which covers the United States, 
  • recorded a 19.1% decline in the first quarter of 2009 versus the first quarter of 2008. 
  • This was the largest decline in the 21-year history of tracking this series.
  • The 10-City and 20-City Composites recorded annual declines of 18.6% and 18.7%, respectively.
The chart below shows the index levels for the U.S. National Home Price Index, as well as its annual returns. As of March 2009, average home prices across the United States are at similar levels to what they were in the fourth quarter of 2002. From the peak in the second quarter of 2006, average home prices are down 32.2%.


Source: S&P/Case-Shiller Home Price Indices
Subscribe to EF Hutton via Email
Follow E F Hutton on Twitter

Kindle: Amazon's Wireless Reading Device (Latest Generation)

Thursday, May 14, 2009

Eggs UP, Energy UP, Food UP, PPI UP, Claims UP


The price of fresh eggs jumped 44 percent, the most since records began in 1992.
Energy goods increased 0.7 percent.
The price of food jumped 1.5 percent.
Producer prices (PPI) rose .3 percent.
Initial jobless claims rose by 32,000 to 637,000 in the week ended May 9, from a revised 605,000 the prior week.
Subscribe to EF Hutton via Email


The Producer Price Index for Finished Goods increased 0.3 percent in April, seasonally adjusted, the Bureau of Labor Statistics of the U.S. Department of Labor reported today. This rise followed a 1.2-percent decline in March and a 0.1-percent increase in February. At the earlier stages of processing, prices received by producers of intermediate goods moved down 0.5 percent following a 1.5-percent decrease a month earlier, and the crude goods index advanced 3.0 percent after declining 0.3 percent in March.

In the week ending May 9, the advance figure for seasonally adjusted initial claims was 637,000, an increase of 32,000 from the previous week's revised figure of 605,000. The 4-week moving average was 630,500, an increase of 6,000 from the previous week's revised average of 624,500.

The advance seasonally adjusted insured unemployment rate was 4.9 percent for the week ending May 2, an increase of 0.1 percentage point from the prior week's unrevised rate of 4.8 percent.

The advance number for seasonally adjusted insured unemployment during the week ending May 2 was 6,560,000, an increase of 202,000 from the preceding week's revised level of 6,358,000. The 4-week moving average was 6,337,250, an increase of 128,750 from the preceding week's revised average of 6,208,500.


Bob DeMarco is a citizen journalist and twenty year Wall Street veteran. Bob has written more than 500 articles with more than 11,000 links to his work on the Internet. Content from All American Investor has been syndicated on Reuters, the Wall Street Journal, Fox News, Pluck, Blog Critics, and a growing list of newspaper websites. Bob is actively seeking syndication and writing assignments.


Follow E F Hutton on Twitter

Tuesday, April 14, 2009

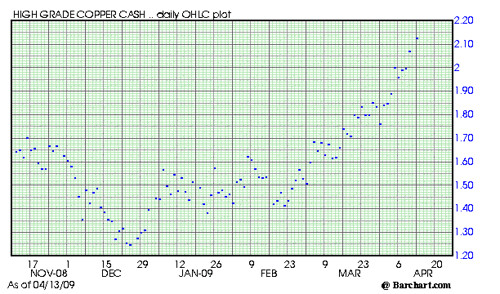
Copper Soaring, China Buying (Chart)


Cash Copper, Daily Price Mark

Cash Copper Chart 414

The chart contains a single price (dot) for each trading day.

Notes:
  • The price of copper is moving up fast. This is being caused by buying out of China.
  • China is a large importer of cooper. They import about 85 percent of their need.
  • On December 24, copper traded at the low price of 124.75.
  • Today the price was marked at 212.55.
  • The price of copper has risen 70 percent in the last 4 months.
You should be looking at Freeport McMoran (FCX). Freeport benefits from rises in the price of copper. The company is also a large producer of gold. We will cover Freeport McMoran tommorow.

You should note the effect that demand from China can have on commodity prices. One theme that should become evident is that when China starts to demand the supply of a commodity its price is likely to rise dramatically. This will create lots of opportunites for smart investors.

There are several ways to take advantage of thirsty demand for commodities from China. These include: sector stocks, ETFs, options, and commodity futures contracts.

We will be honing in on these opportunities in the days and weeks ahead.

So stay tuned daily.
Subscribe to EF Hutton via Email

Bob DeMarco is a citizen journalist and twenty year Wall Street veteran. Bob has written more than 500 articles with more than 11,000 links to his work on the Internet. Content from All American Investor has been syndicated on Reuters, the Wall Street Journal, Fox News, Pluck, Blog Critics, and a growing list of newspaper websites. Bob is actively seeking syndication and writing assignments.


Tuesday, March 31, 2009

S & P Case Shiller Home Price Indices Chart (Rated X)


Data through January 2009, released today by Standard & Poor’s for its S&P/Case-Shiller1 Home Price Indices, the leading measure of U.S. home prices, shows continued broad based declines in the prices of existing single family homes across the United States, with 13 of the 20 metro areas showing record rates of annual decline, and 14 reporting declines in excess of 10% versus January 2008.


SP Case Shiller Home Price Indices Chart
Subscribe to EF Hutton via Email

Wednesday, March 11, 2009

Roubini on the Housing Sector


The following is from the RGE Monitor email I received this morning.

Housing Sector

The fourth year of housing recession - and the worst housing recession since the Great Depression - is well on course.

Total housing starts have plunged from the 2.3 million seasonally adjusted annual rate (SAAR) peak of January 2006 all the way to the 466 thousand SAAR of January 2009 (the last data point available), an all time low for the time series that started in January 1959. Single-family starts built for sale are down 81% from their Q1 2006 peak (since seasonally adjusted data is not available, we performed our own seasonal adjustment).

On the demand side, new single-family home sales are down 76% from their July 2005 peak. Both demand and supply of homes are therefore still falling very sharply which does not bode well for inventories. Inventories are the mortal enemy of prices for any goods-producing sector, including housing.

The sharp and unprecedented fall of starts might not have reached a bottom yet. In this economy-wide recession, weakness on the demand side of housing is bound to persist and we believe that supply will have to fall further, given the great wave of foreclosures that is adding to the excess of supply in the market.

We believe that home prices will not bottom out until the middle of 2010. Our target is a 38% peak to trough (so far prices have fallen over 27% from the peak) but given the worsening conditions on the real side of the economy, we see a meaningful chance for over-correction that would bring prices down 44% from the peak reached in the first half of 2006 (Case-Shiller is the reference index for these predictions.)

RGE Monitor offers and premium service that provides more detailed information.
Subscribe to EF Hutton via Email

Sunday, February 01, 2009

Option ARM--The Toxic Mortgage


'Option ARM' mortgages were agressively marketed by banks because they generated huge amounts of phantom profits. Using generally accepted accounting principles, or GAAP, banks could count as revenue the highest amount of an Option ARM payment -- the so-called fully amortized amount -- even when borrowers made only the minimum payment. In other words, banks could claim "phantom income" that they never received and in the current scenario will never receive. This "phantom income" inflated reported earnings and allowed bank executives playing this game to receive enormous bonus income and enjoy dramatically inflated stock prices. Many now defunct banks, and soon to be defunct banks, reported inflated earnings that were bolstered by this phantom income. It was not unusual for "phantom income" to account for more than half of the earnings being reported.
James Grant wrote that negative-amortization accounting is "frankly a fraudulent gambit. But what it lacks in morality, it compensates for in ingenuity."--Grant's Interest Rate Observer
He wrote this back in 2006.

Default rates on so called 'Option ARM' mortgages are rising fast.
As of December, 28% of option ARMs were delinquent or in foreclosure, according to LPS Applied Analytics, a data firm that analyzes mortgage performance.
Nearly 61% of option ARMs originated in 2007 will eventually default, according to a recent analysis by Goldman Sachs.
This sobering news indicates that the bad news from the housing market is far from over and is not likely discounted in the stock markets.

Subscribe to EF Hutton via Email

An 'Option ARM' is typically a 30-year adjustable rate mortgage that initially offers the borrower four monthly payment options: a specified minimum payment, an interest-only payment, a 15-year fully amortizing payment, or a 30-year fully amortizing payment. These types of loans are also called "pick-a-payment" or "pay-option" ARMs.

'Option ARMs' are particularly toxic because they allow the borrower to make a small minimum payment each month with the unpaid part of the monthly payment being added to the principle of the mortgage outstanding. In other words, these mortgages are subject to severe negative amortization. If you make the minimum payment, the principle amount you owe on the mortgage loan goes up each and every month. Current statistics indicate that 80 percent of the consumers owning these loans selected the minimum payment option.

Let's say, for example, that the fully amortized monthly payment is set at $1500. The homeowner decides to elect the minimum payment (the option) and pays $1000. The unpaid $500 is then added to the mortgage's principle balance outstanding. It only gets worse. Not only does the amount owed grow each month; this higher loan balance is immediately reflected in the next month's calculation.

The owner of an 'Option ARM' is borrowing the difference between the minimum payment and fully amoritized amount of the loan each month. In effect, the option arm mortgage holder is making a new loan each month and this amount is tacked onto the existing mortgage. Then the mortgage holder ends up paying interest not only on the increasing principle but also interest on interest. Sounds a little like loan sharking--doesn't it?

It is easy to see that the amount owed on an option ARM mortgage could grow fast. Imagine watching the amount you owe on your mortgage go up each month as you make the minimum payment. It only gets worse. This 'ticking time bomb" of a mortgage has another toxic feature built in--they reset once the principle balance owed hits 110-125% of the original loan. This fully amortized amount includes the original loan amount plus all the negative amortization. So while it appears that an 'Option ARM' works like a typical adjustable rate mortgage this in not true. A standard adjustable rate mortgages has an annual cap and the interest rate can only rise by 1-2% a year. This is true in an "option ARM" with one exception--when the 110-125% cap is hit the mortgage fully amortizes and the morgage resets to the market. This means a monster sized jump in the monthly payment. It is likely that the owner of the 'Option ARM' will see the monthly mortgage payment nearly double when the cap is hit.

Current owners of these "time bombs" are now in the unenviable postion of watching the amount they owe on the mortgage go up, the amount of their monthy payment skyrocket, and the value of the house drop like a lead stone. Talk about a double edged sword. Or is that three edges?

It appears most American's are making an easy decisions on these loans--walk away, stop paying, and go to foreclosure.
Nearly $750 billion of option adjustable-rate mortgages, or option ARMs, were issued from 2004 to 2007, according to Inside Mortgage Finance, an industry publication.
Rising delinquencies are creating fresh challenges for companies such as Bank of America Corp., J.P. Morgan Chase & Co. and Wells Fargo & Co. that acquired troubled option-ARM lenders.
Interestingly, most 'Option ARMs' were issued to people with an above sub-prime credit rating. However, it is well known that many of these mortgage holders bought homes they intended to sell "quickly" for a profit. In effect, they were speculating in the housing market. What better way to keep the payment low than with the 'Option ARM' mortgage.

'Option ARM' mortgages were agressively marketed by banks because they generated huge amounts of phantom profits. Using generally accepted accounting principles, or GAAP, banks could count as revenue the highest amount of an Option ARM payment -- the so-called fully amortized amount -- even when borrowers made only the minimum payment. In other words, banks could claim "phantom income" that they never received and in the current scenario will never receive. This "phantom income" inflated reported earnings and allowed bank executives playing this game to receive enormous bonus income and enjoy dramatically inflated stock prices. Many now defunct banks, and soon to be defunct banks, reported inflated earnings that were bolstered by this phantom income. It was not unusual for "phantom income" to account for more than half of the earnings being reported.
James Grant of Grant's Interest Rate Observer wrote that negative-amortization accounting is "frankly a fraudulent gambit. But what it lacks in morality, it compensates for in ingenuity."
He wrote this back in 2006.

Many banks moved defaulted 'Option ARMs' into "held for sale accounts". This shady accounting practice allowed banks to sequester or "hide" the loans from investors. Under normal economic conditions these loans would be sold to collection agencies or investors. However, given the enormous amounts of these loans, their uncertain futures, and the uncertainty in the market place they are now nearly impossible to sell.

When you hear proposals for the Federal government to buy "toxic assets" these are the types of loans that bankers want taxpayers to take off their hands. The bankers that issued three quarters of a billion dollars of Option Arms did so to enrich themselves.
  • They have already received obscene bonuses and sold inflated stock bolstered by "phantom income".
  • They now want to pass these assets to taxpayers via the bailout.
  • They want us to bail them out so they can stay in their jobs.

I continue to wonder if anyone in Washington understands this scam? Or, are they going to perpetuate the scam and pass the buck to our children?

It should be mentioned that banks paid higher than usual commissions on these loans to the "hordes" of unregulated independent salespeople they used to "huckster" this product. It is already well documented that many of these so called "mortgage bankers" used pressure tactics to convince consumers that an 'Option ARM' was a good thing and that they would benefit. They might have failed to mention the onerous prepayment fees that came with these mortgages and it not likely that they explained the how negative amortization worked. I wonder if they fully disclosed that the loan became full amortized when the 110-125% cap limit was hit? Did they explain that the cap limit would be hit within five years if they made the minimum payment; and that, the monthly payment could nearly double or worse?

I believe most stock market investors think that the effects of the housing crisis has been discounted by the markets. This is not likely and the potential fallout from the coming 'Option ARMs' explosion is still to be seen.

We have not yet reached the worst part of the 'Option ARM' cycle. The news on these toxic loans is going to get worse beginning in April when thousands of Option ARM mortgage holders are going to see their monthly payments spike. This phenomena is going to continue until 2010 once it starts.

I wonder if investors understand how this will effect the banks that are still holding these loans? How the shock wave from this explosion is likely to effect banks that do business with these banks? How this might effect consumers, employment, and the psyche of investors? Uncertainty does not usually lead to sustained rallies in the markets. Of course, the market might take a tumble and discount this information at any time.

Option ARM--The Toxic Mortgage


Wednesday, January 07, 2009

According to Prudential Douglas Elliman's Dottie Herman, what likely sparked a 3.6% drop in Manhattan apartment prices?


CNBC Bonus Bucks Trivia
CNBC Million Dollar Portfolio Challenge

The Call

Question: According to Prudential Douglas Elliman's Dottie Herman, what likely sparked a 3.6% drop in Manhattan apartment prices?

Answer: Lehman Bros. bankruptcy

Subscribe to EF Hutton via Email


Manhattan Apartment Prices Fall Nearly 4%

Prices of existing Manhattan apartments fell nearly 4 percent in the fourth quarter, two reports showed, and analysts warned of much deeper declines in coming months in the wake of turmoil on Wall Street and financial sector layoffs.

The median sales price—in which half the sales prices were higher and half were lower—of an existing Manhattan apartment fell 3.6 percent to $732,500, according to the Prudential Douglas Elliman Manhattan Fourth Quarter Market Overview.

"You could say it started the second week of September when Lehman (Brothers) filed for bankruptcy," said Dottie Herman, chief executive of Prudential Douglas Elliman, one of the United States' largest real estate companies. "Up until then, New York City was holding its own and after that people were in shock. Things they trusted their whole lives just fell apart."

Herman sees a possible price decline of 20 percent to 25 percent afflicting the entire Manhattan market in the first quarter.

According to the Corcoran/PropertyShark report, median existing sales prices fell 4 percent year over year to $759,000 in the fourth quarter.

Prices of existing homes, also called resale prices, fell in only one other quarter in the past five years, by 1.1 percent in the fourth quarter of 2006, and that was something of a blip, said appraiser Jonathan Miller, author of the Prudential report.

These numbers, on the other hand, are a leading indicator of more declines to come, because resale prices are not susceptible to distortion like sales figures for new construction, in which contracts are signed up to 18 months before the sale is completed.

The lag time between the signing and closing of a resale contract is much shorter, Miller said.

In this quarter, for example, the median sales price of new housing in Manhattan rose 33 percent to $1.54 million, but that number is not necessarily indicative of the current market because many of those contracts were signed months or even years ago, according to the Corcoran/PropertyShark report.

Such sales distorted this quarter's figures altogether, Miller said, resulting in an overall rise in median sales prices of 5.9 percent to $900,000. Without them, the rest of the market would look more like the lackluster resale market.

A telling sign of further future price declines is Miller's monitoring of contracts in the works, pre-closing.

Current contract price levels show an average drop of 20 percent from August 2008, said Miller, who said such price declines are a real possibility marketwide in Manhattan.

Indeed, the first quarter will reveal the depths of the damage wrought by the implosion of the banking sector and tens of thousands of layoffs on Wall Street in a way the fourth quarter has not, said Gregory Heym, the chief economist for brokerage Brown Harris Stevens.

His fourth quarter report showed a very slight rise in the median sales price of Manhattan apartments, both new and existing, to $895,000 from $828,000, but more financial sector job losses could lie ahead for Manhattan, which means more pain for real estate.

"We're just going to be living with a certain degree of uncertainty for a lot longer," Heym said. "I know it's been about a year and a half and people would like things to calm down a bit but it's going to take a bit longer."
Copyright 2009 Reuters. Click for restrictions.

URL: http://www.cnbc.com/id/28517399/
Privacy Policy . Terms of Service
© 2009 CNBC.com