"The year-and-a-half decline in manufacturing output has come to an end, as 11 of 18 manufacturing industries are reporting growth when comparing August to July. While this is certainly a positive occurrence, we have to keep in mind that it is the beginning of a new cycle and that all industries are not yet participating in the growth. The August index of 52.9 percent is the highest since June 2007. The 4 percentage point increase was driven by significant strength in the New Orders Index, which is up 9.6 points to 64.9 percent, the highest since December 2004. The growth appears sustainable in the short term, as inventories have been reduced for 40 consecutive months and supply chains will have to re-stock to meet this new demand."
Subscribe to EF Hutton via Email
WHAT RESPONDENTS ARE SAYING ...
- "Production is picking up as demand [for] orders is being accelerated." (Nonmetallic Mineral Products)
- "Demand from automotive manufacturers increasing thanks to 'Cash for Clunkers.'" (Fabricated Metal Products)
- "In addition to improved business come the complications of a supply chain drained of inventory." (Paper Products)
- "The sudden increase in customer demand, plus the low inventories held at services centers, is causing a shortage in the supply of raw steel." (Transportation Equipment)
- "[It] appears customers' inventories are getting low, and they are cautiously placing orders." (Apparel, Leather & Allied Products)
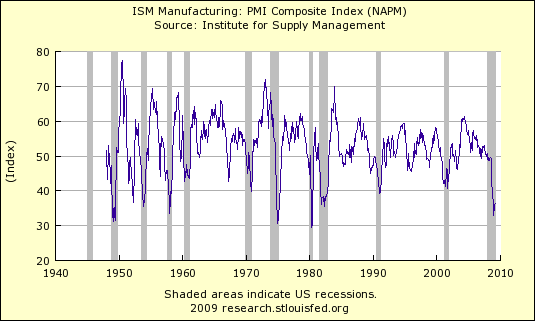
Manufacturing's 18 consecutive months of decline ended in August as the PMI registered 52.9 percent, which is 4 percentage points higher than the 48.9 percent reported in July. This is the highest reading since June 2007, when the index also registered 52.9 percent. A reading above 50 percent indicates that the manufacturing economy is generally expanding; below 50 percent indicates that it is generally contracting.
A PMI in excess of 41.2 percent, over a period of time, generally indicates an expansion of the overall economy. Therefore, the PMI indicates growth for the fourth consecutive month in the overall economy, as well as expansion in the manufacturing sector for the first time since January 2008. Ore stated, "The past relationship between the PMI and the overall economy indicates that the average PMI for January through August (42.2 percent) corresponds to a 0.3 percent increase in real gross domestic product (GDP). However, if the PMI for August (52.9 percent) is annualized, it corresponds to a 3.7 percent increase in real GDP annually."
 Bob DeMarco is a citizen journalist and twenty year Wall Street veteran. Bob has written more than 700 articles with more than 18,000 links to his work on the Internet. Content from All American Investor has been syndicated on Reuters, the Wall Street Journal, Fox News, Pluck, Blog Critics, and a growing list of newspaper websites. Bob is actively seeking syndication and writing assignments. Bob DeMarco is a citizen journalist and twenty year Wall Street veteran. Bob has written more than 700 articles with more than 18,000 links to his work on the Internet. Content from All American Investor has been syndicated on Reuters, the Wall Street Journal, Fox News, Pluck, Blog Critics, and a growing list of newspaper websites. Bob is actively seeking syndication and writing assignments. |
 Wireless Reading Device